
From Data to Insights: When Data Speak Louder Than Your Customers
By: Dr. Evi Rinawati Simanjuntak, M.M.
Companies extract data to gain insights from customers data by having a clear focus on business problems. These data can be gathered from different sources and tools, depending on what problems the company wants to overcome. Below are four companies from four different industries use their data in different ways and from different sources.
Amazon utilizes the data of their customers’ past purchase behavior to predict what they are likely to order in the future. This allows Amazon to manage their inventory in a better way. Data is collected from their internal data (historical). Customer past purchase behaviour was utilized in order to determine what product is match on the customer based on their orders. Buying cycle changes (CRM customer cycle measure) and cost reduction measures (efficiency) are two most important insights that can be gained through the process.
Heineken sees that beer drinking is part of consumers’ social life and are expressed through social signals. They deployed @wherenext tweets on social media in order to determine what event, location, restaurant is popular now. This insight was gathered by the company through social media listening tools and utilize it to create a campaign. They used this information to have users post their relevant hashtags and push them to purchase Heineken products.
In Indonesia, Gojek uses geo visualization analytics using GPS points in real-time, showing demand/supply ratios. This data drives decisions like driver allocation, surge pricing, driver incentives and many more.
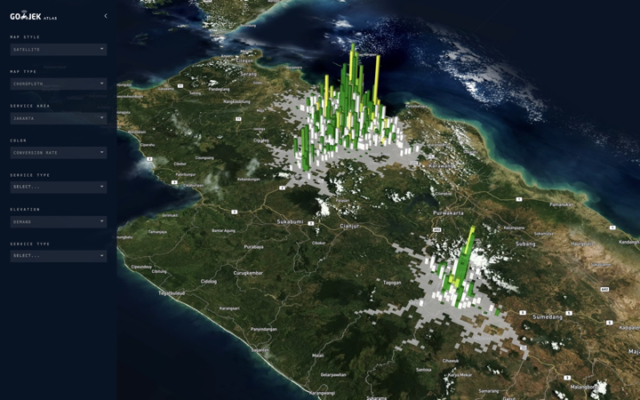
Source: https://blog.gojekengineering.com/atlas-go-jeks-real-time-geospatial-visualization-platform-1cf5e16814c5
Meanwhile Zalora, the Southeast Asia fashion e-retailer, take data analytics religiously, with their ‘data first, then fashion’ strategy. They use customer analytics to understand customer journey along the sales funnel and to increase positive customer experience in every stage of the funnel. They have been using Google BigQuery to identify the drop-off rate at particular points during the checkout flow. The information is used to improve usability and user experience or to correct product problems, in order to increase conversion rate. In addition to that, a new platform called Trender is launched in April 2020, to allow brands find user insights which can help them make decisions on marketing, merchandising, design and product development.
Each of these companies capitalizes the insights differently; Amazon can now deliver almost instantly to customers, developing closer customer bonds measured in the customer cycle CRM measurements of service satisfaction. They are able to do this by predicting future purchases of their customers, so they can optimally locate the nearest warehouses and stock them with appropriate products, therefore also reduces their inventory time and improves their cash conversion cycle, which could be measured under company 3E measures of efficiency – reducing costs. Heineken utilizes their data by creating a social media-based campaign, gathering this information to then create a unique experience for their customers. This measures the company & customer worth, improving customer equity by creating a better subjective view and loyalty feelings, as they created ‘strong affinity for the brand’, along with successful acquisition for new customers, shown by ‘5% volume growth’. Zalora improves their funnel conversion rate, while Gojek optimize the supply and demand ratio together with dynamic pricing mechanism to gain revenue maximization.
Above cases tell us that the journey from data to insight continues further into business growth. Businesses should not overlook data analytics anymore, whether it is internal or external data, historical or forecasted one, if analyzed properly, will leverage the growth of the business.
(Students in Business Management and Marketing – International Undergraduate Program will learn relevant topics on digital analytics under the course: Web Analytics and e-CRM. Visit our Business Management and Marketing curriculum to know more.)
Sources:
https://www.thedrum.com/news/2020/04/28/zalora-says-it-data-first-then-fashion-company
https://www.tableau.com/solutions/customer/gojek-achieves-robust-growth-with-data
Dr. Evi Rinawati Simanjuntak is currently a Subject Content Coordinator and Faculty Member in Business Management and Marketing Program at Binus Business School International Undergraduate Program. Further about her profile can be found here.
Comments :