Financial Analysis of PT DCI Indonesia Tbk
![]()
Written by:
- Marivi Calaguan
- Davy Satria
- Rivano Nugroho
- Nitolonia Fernando Lifao
01 Company Overview
1.1 Our Company
Business Description
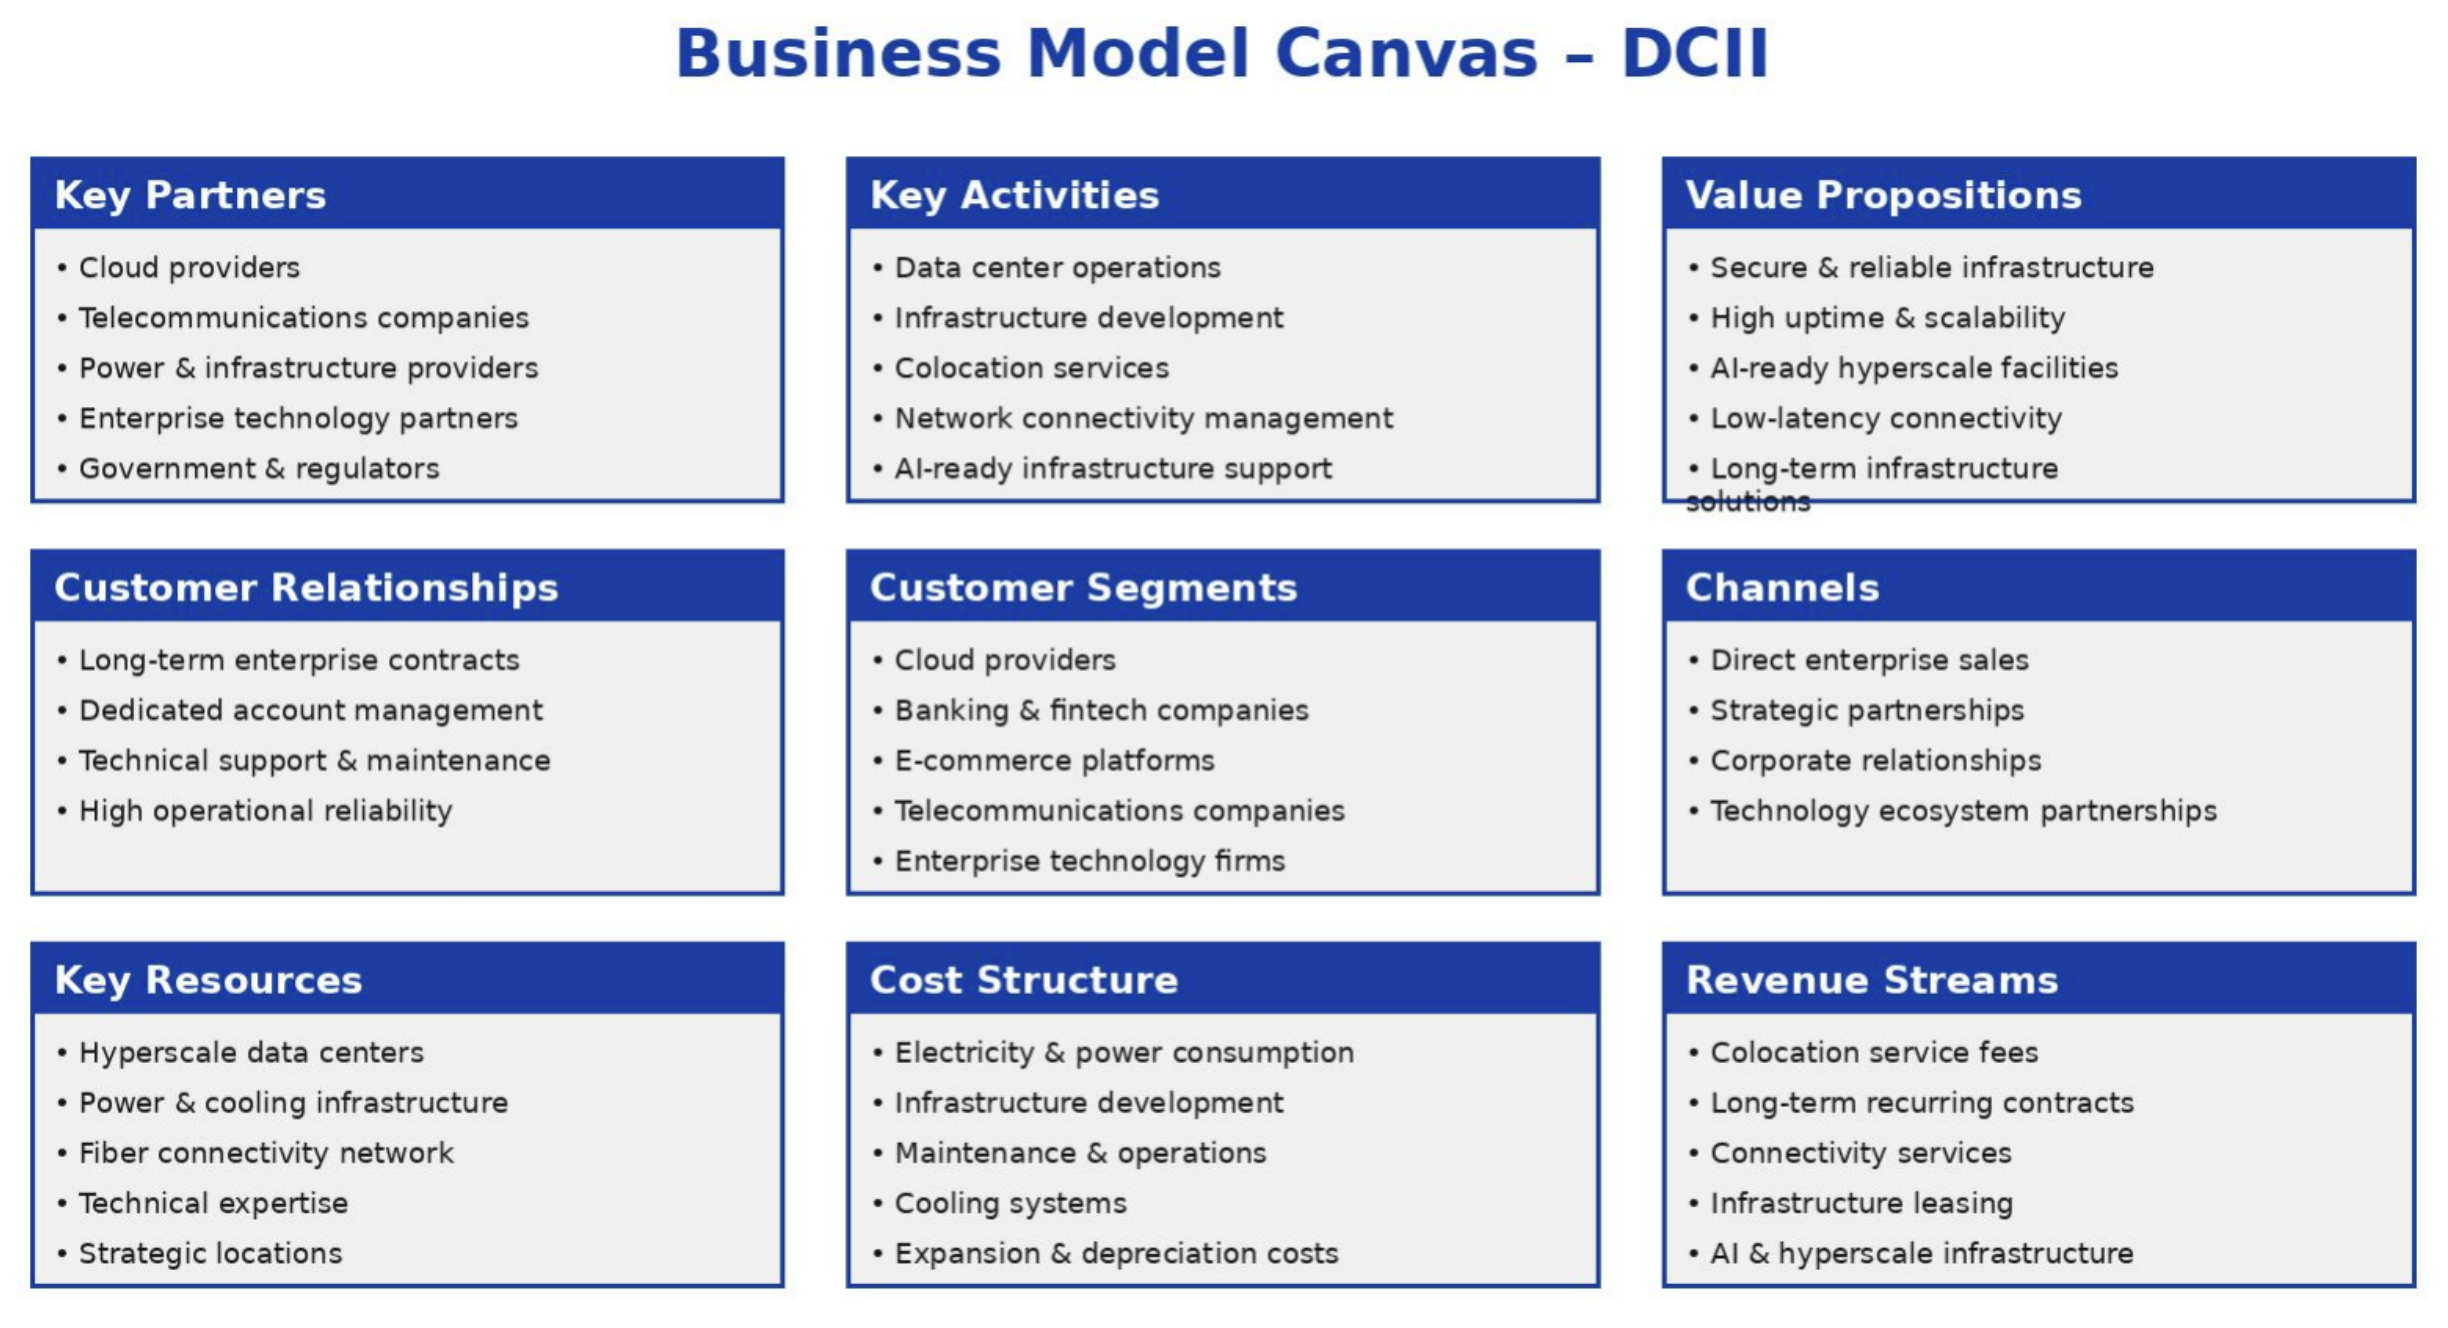
Leading Indonesian hyperscale data center and digital infrastructure provider supporting cloud computing, AI, fintech, telecommunications, and enterprise digitalization.
Revenue Model
Primarily generates recurring revenue through colocation services and long-term enterprise contracts.
Services
Colocation services, Hyperscale data centers, AI-ready infrastructure, Interconnection & connectivity, Disaster recovery solutions .
Key Customers / Industries Served
Cloud providers, Banking & fintech, E-commerce platforms, Telecommunications, Enterprise technology companies.
Revenue Drivers
Cloud computing growth, AI adoption, Fintech & e-commerce expansion, Indonesia’s digital transformation, Data localization regulations.
1.2 Corporate Structure & Shareholder
Ownership Structure
Ownership is relatively concentrated among major shareholders and founders, allowing strong strategic control and long-term decision making.
Founder Involvement
Founders remain actively involved in the company’s strategic direction and expansion plans.
Governance Implications
Strong founder control supports faster execution and long-term vision, but also increases the importance of transparency and minority shareholder protection.
Company Structure
DCII operates as a capital-intensive infrastructure company focused on: Data center development, Digital infrastructure operations, Long-term recurring contracts, Continuous expansion and reinvestment
02 Industry Overview
2.1 Industry Overview
Indonesia’s Digital Economy Growth
Indonesia is currently one of Southeast Asia’s fastest-growing digital economies. Several factors drive this growth:
- Rapid internet penetration
- Increasing smartphone adoption
- Expansion of e-commerce platforms
- Growth of fintech services
- Government digital transformation initiatives
- Rising AI and cloud computing demand
The growth of cloud computing and AI significantly increases the need for data storage, processing power, and server infrastructure. This creates strong long-term demand for data center operators such as DCII.
2.2 Data Center Industry Characteristics
The data center industry has several unique characteristics:
1. Capital Intensive Industry
Building data centers requires massive upfront investment in:
- Land acquisition
- Power infrastructure
- Cooling systems
- Fiber connectivity
- Security systems
- Server infrastructure
Industry estimates suggest that development costs can reach hundreds of billions of rupiah per megawatt (MW).
2. High Barriers to Entry
Not all companies can easily enter this industry because:
- Technical expertise is required
- Infrastructure costs are enormous
- Reliability standards are strict
- Long-term customer trust is essential
3. Long-Term Recurring Revenue
Most clients sign long-term contracts, creating predictable revenue streams. This stability supports debt financing and long-term expansion planning.
4. Scalability Potential
Once infrastructure is established, data center companies can expand capacity efficiently, creating economies of scale.
2.3 Competitive Landscape
Indonesia’s data center industry has become increasingly competitive. Key competitors include:
- EDGE DC
- Princeton Digital Group
- NTT Global Data Centers
- Telkom Indonesia subsidiaries
- International hyperscale operators
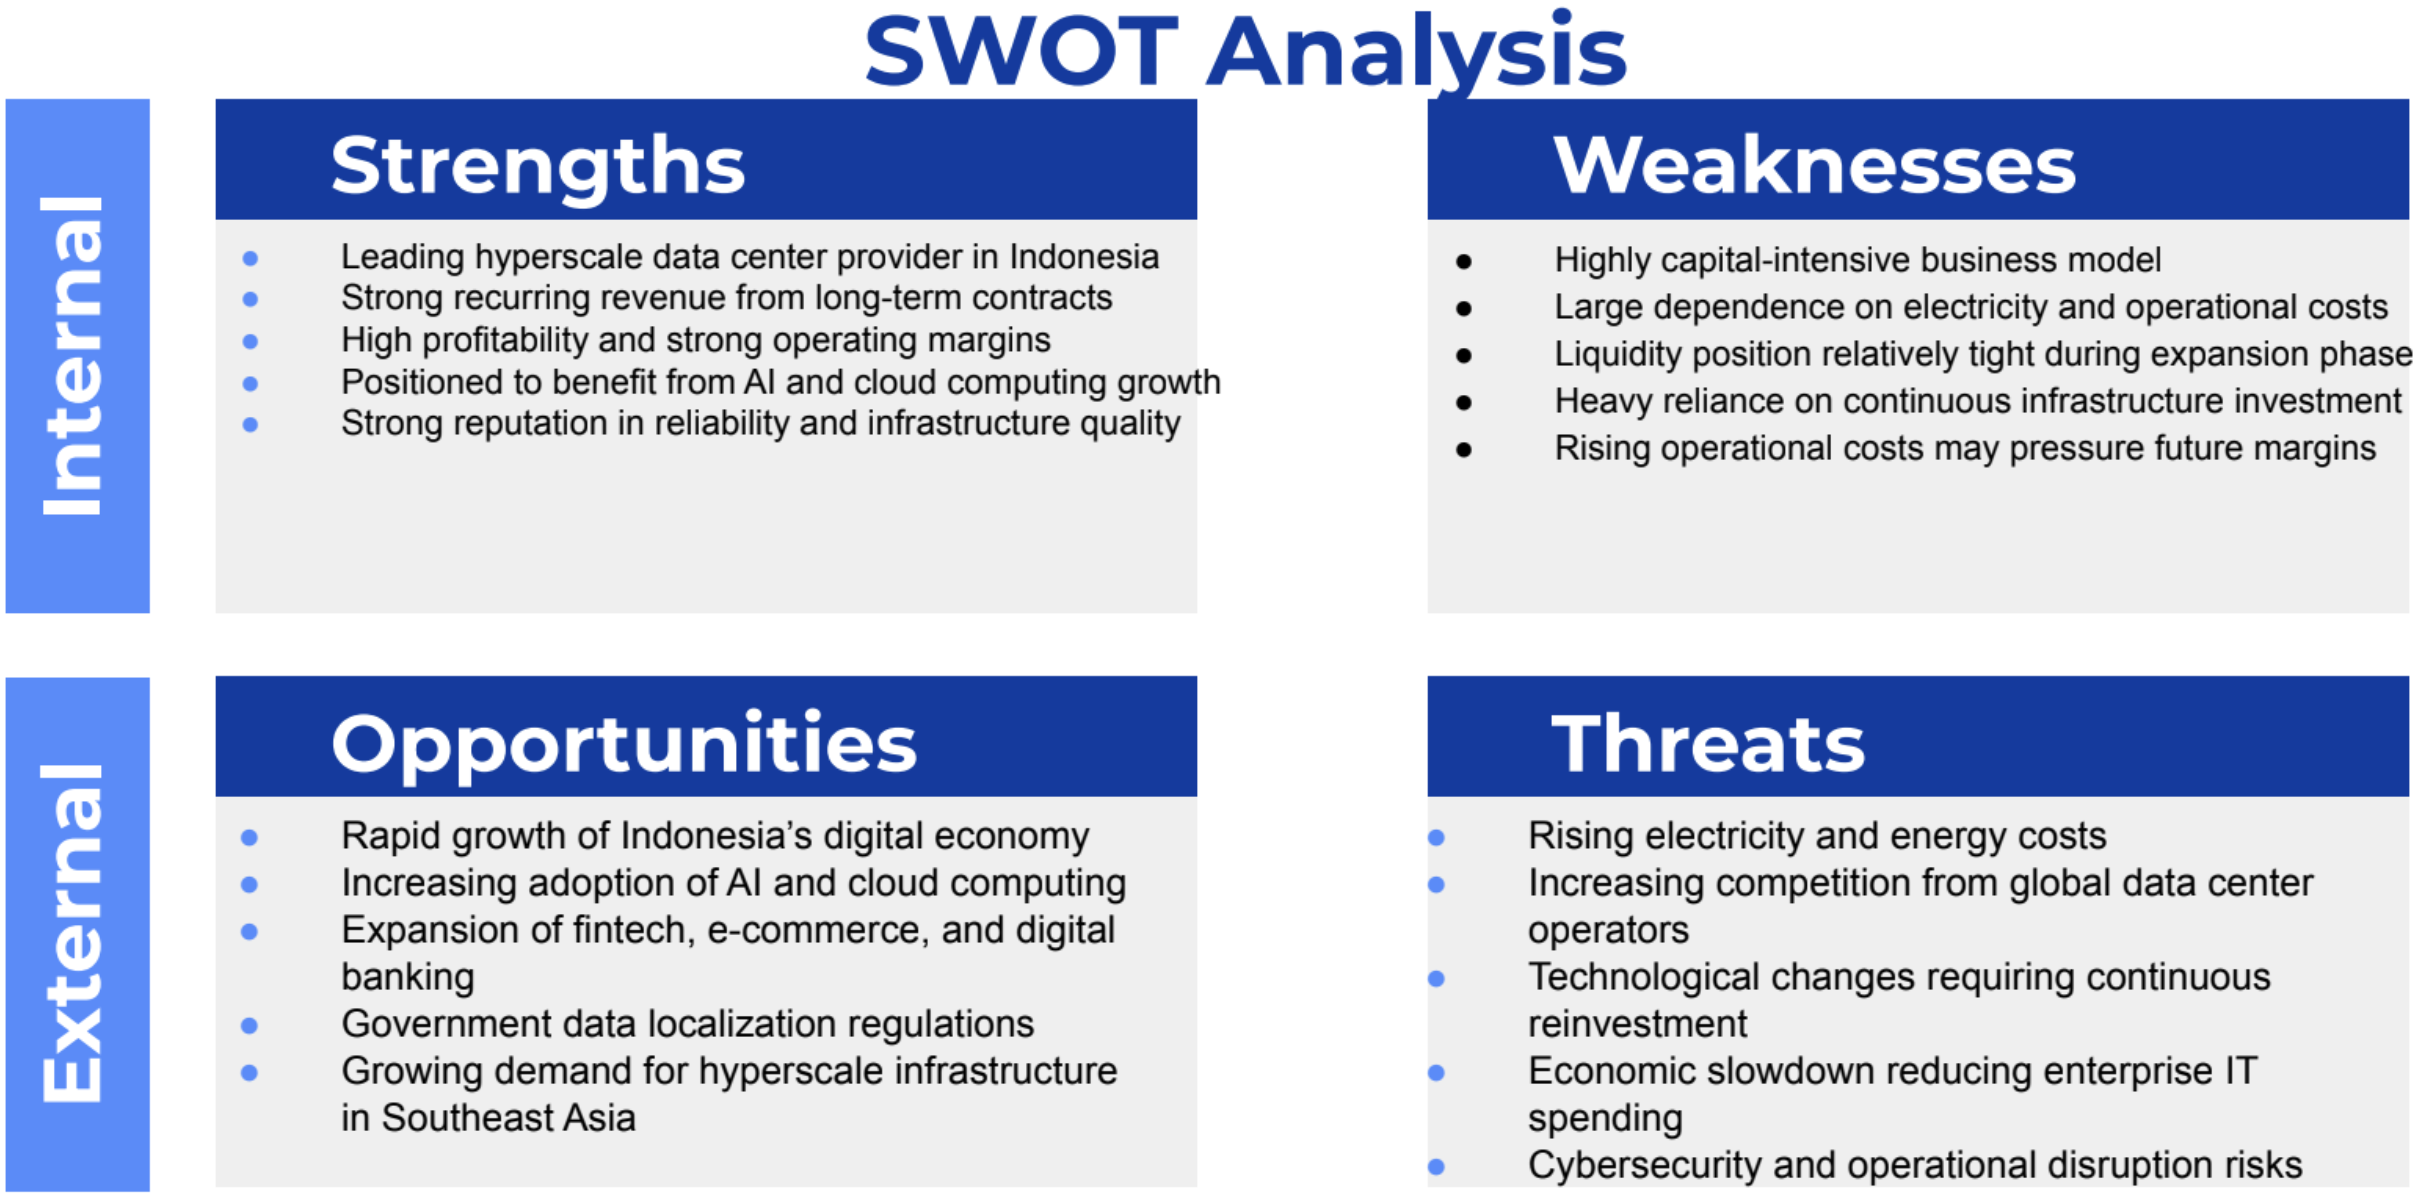
Despite rising competition, DCII maintains a strong position due to:
- Established infrastructure
- Operational reliability
- Strong customer base
- Strategic partnerships
03 Financial Statement Analysis
3.1 Strong Revenue and Net Profit Growth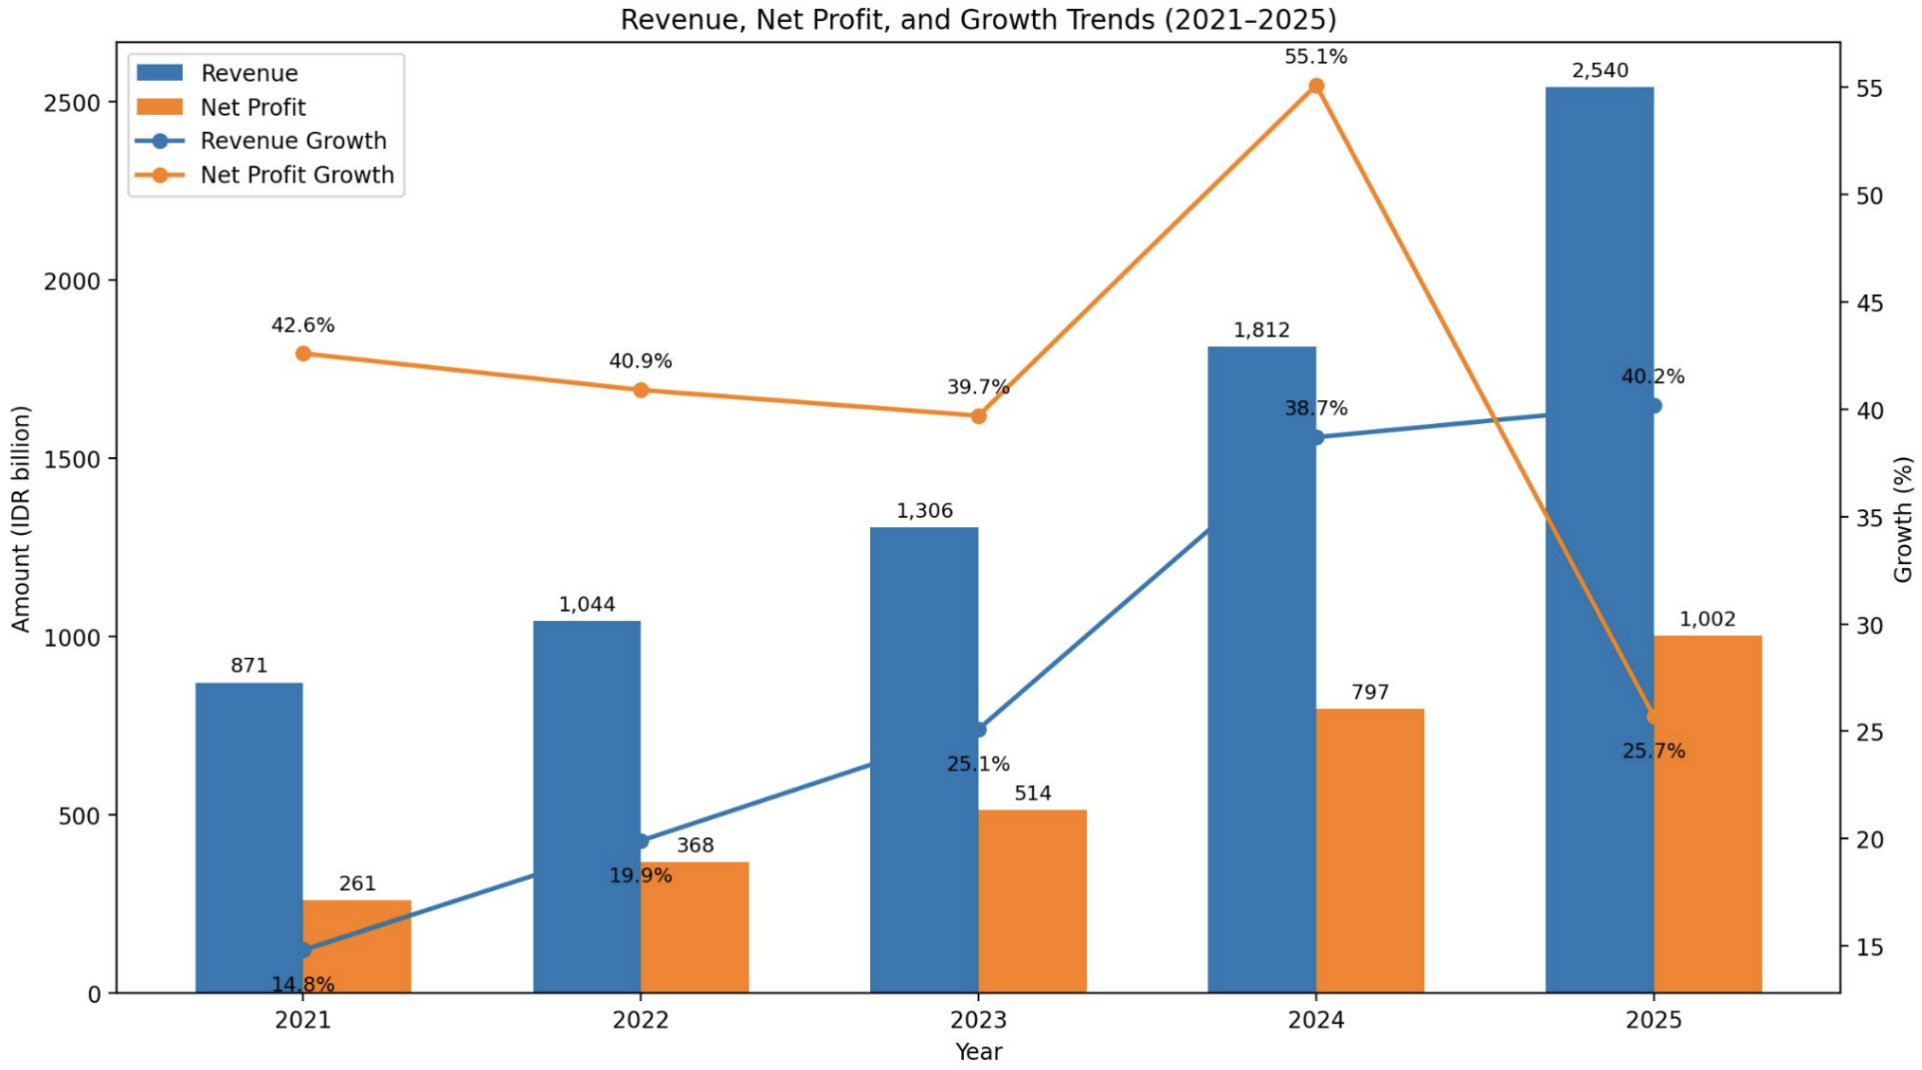 DCII’s revenue grew from IDR 871B in 2021 to IDR 2,540B in 2025, and net profit rose from IDR 261B to IDR 1,002B. This growth is visible across all levels. Colocation service is the primary revenue source. While the growth trend is strong, the 2025 pattern shows revenue grew 40.2%, but net profit grew only 25.7%, requiring closer analysis.
3.2 Healthy Profitability Ratios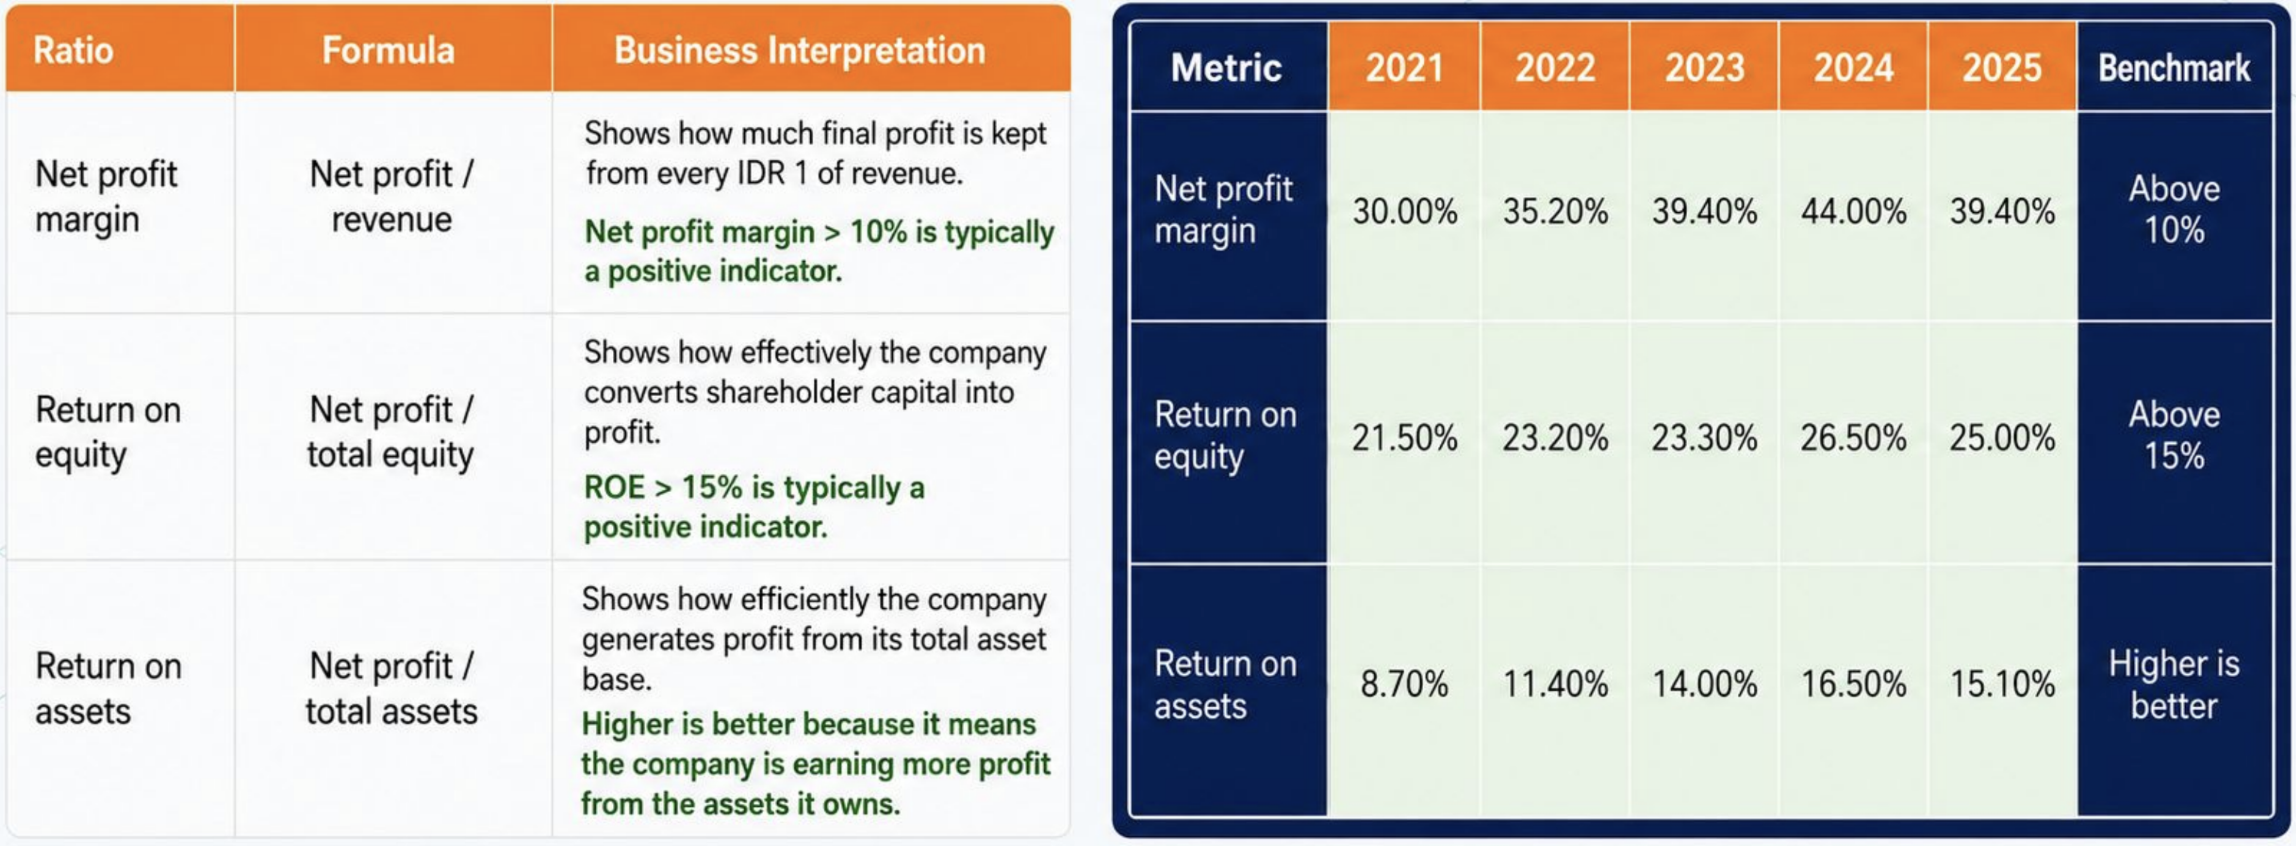
3.3 Tight Liquidity, Gradually Manageable Debt

DCII faces tight liquidity in 2024-2025, with a current ratio below 1.0x, negative net working capital, and a cash ratio below the 0.3x benchmark, indicating a small immediate cash buffer relative to short-term obligations (such as account payable).
DCII’s debt position has significantly improved less debt reliance. Debt-to-capital also improved, remaining under the 40% benchmark since 2023, suggesting manageable debt. Must ensure new debt-funded assets yield sufficient future returns.
3.4 Lower Debt Reliance, Lower Net Gearing Ratio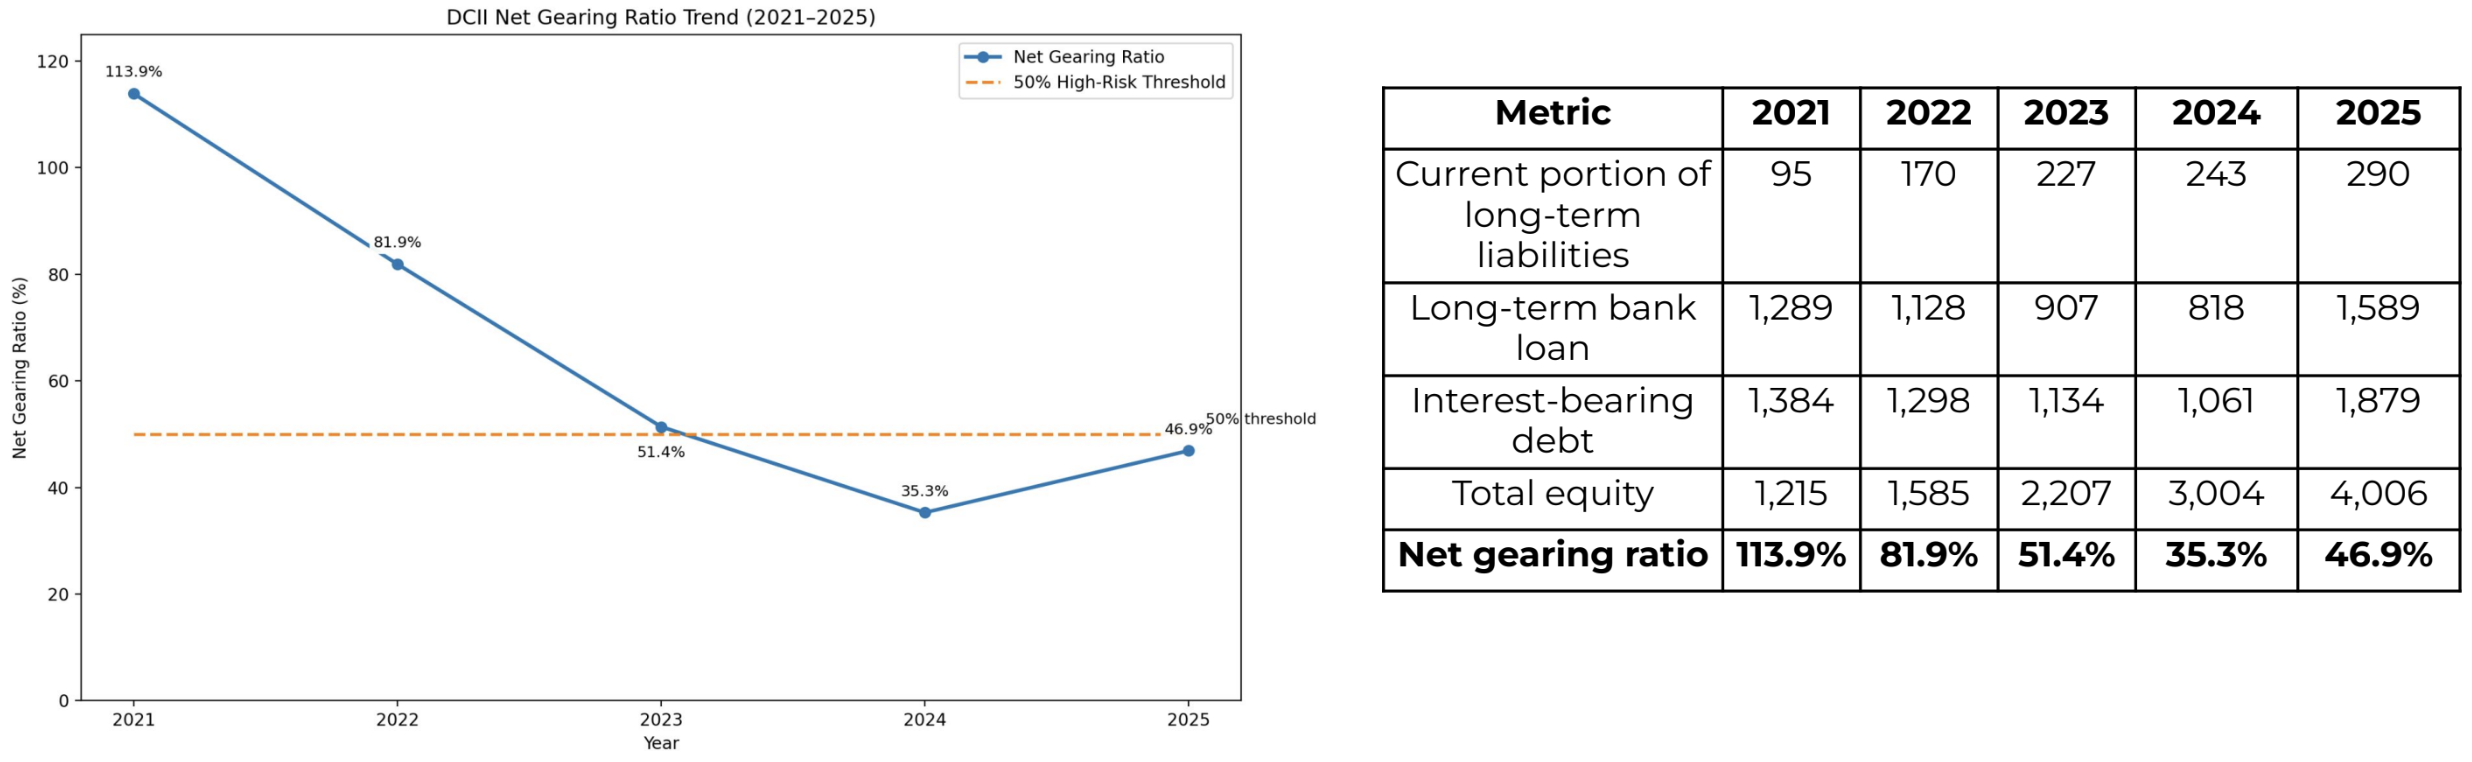 Net gearing ratio measures how much interest-bearing debt the company has compared with its equity. DCII improved from 113.9% in 2021 to 46.9% in 2025, moving below the 50% high-risk threshold.
3.5 Strong Cash Flow, Heavy Reinvestment
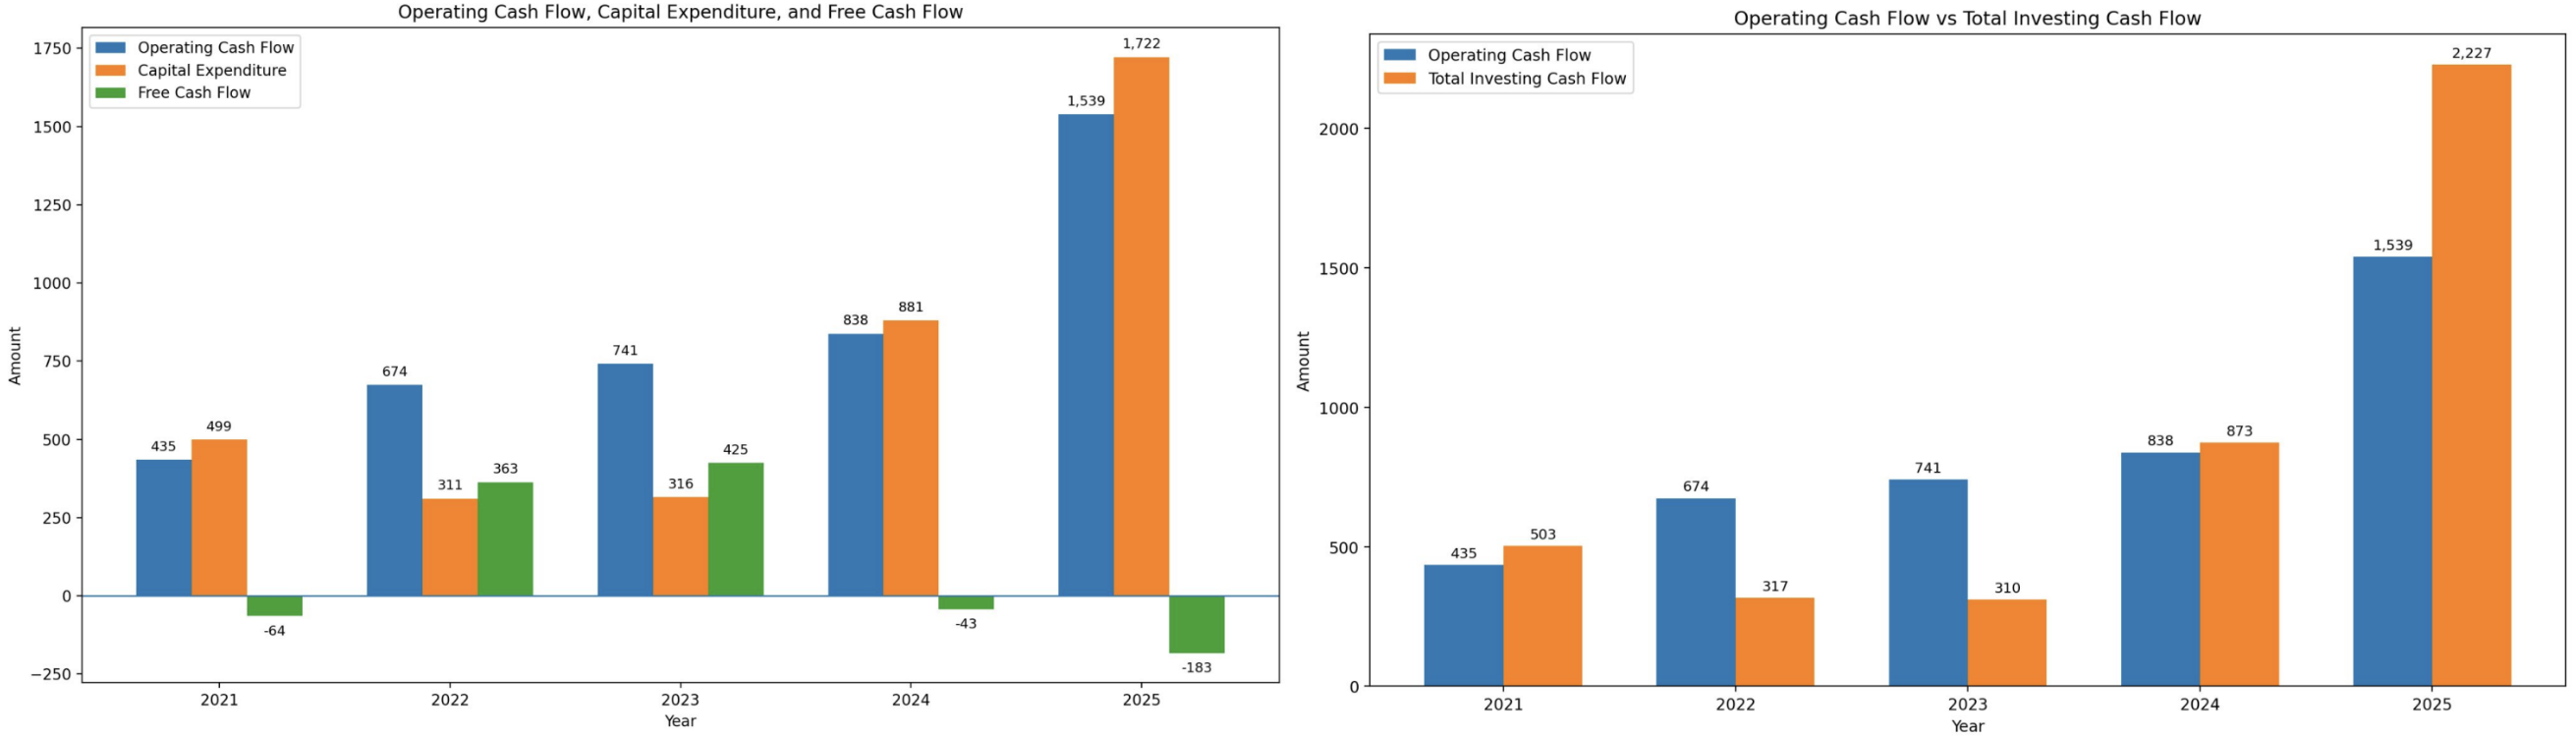 Capital expenditure and investing cash flow are shown as positive values for comparison, although they are recorded as cash outflows in the cash flow statement
DCII’s investment spending should be compared with its ability to generate operating cash flow. In 2024 and 2025, operating cash flow could not fully cover capital expenditure or total investing cash flow, causing free cash flow to turn negative. This is understandable for a growing data center company, but it shows that DCII’s expansion remains cash-intensive and must translate into future revenue and operating cash flow.
3.6 Solid Earnings Quality, Yet 2024 Needs Attention
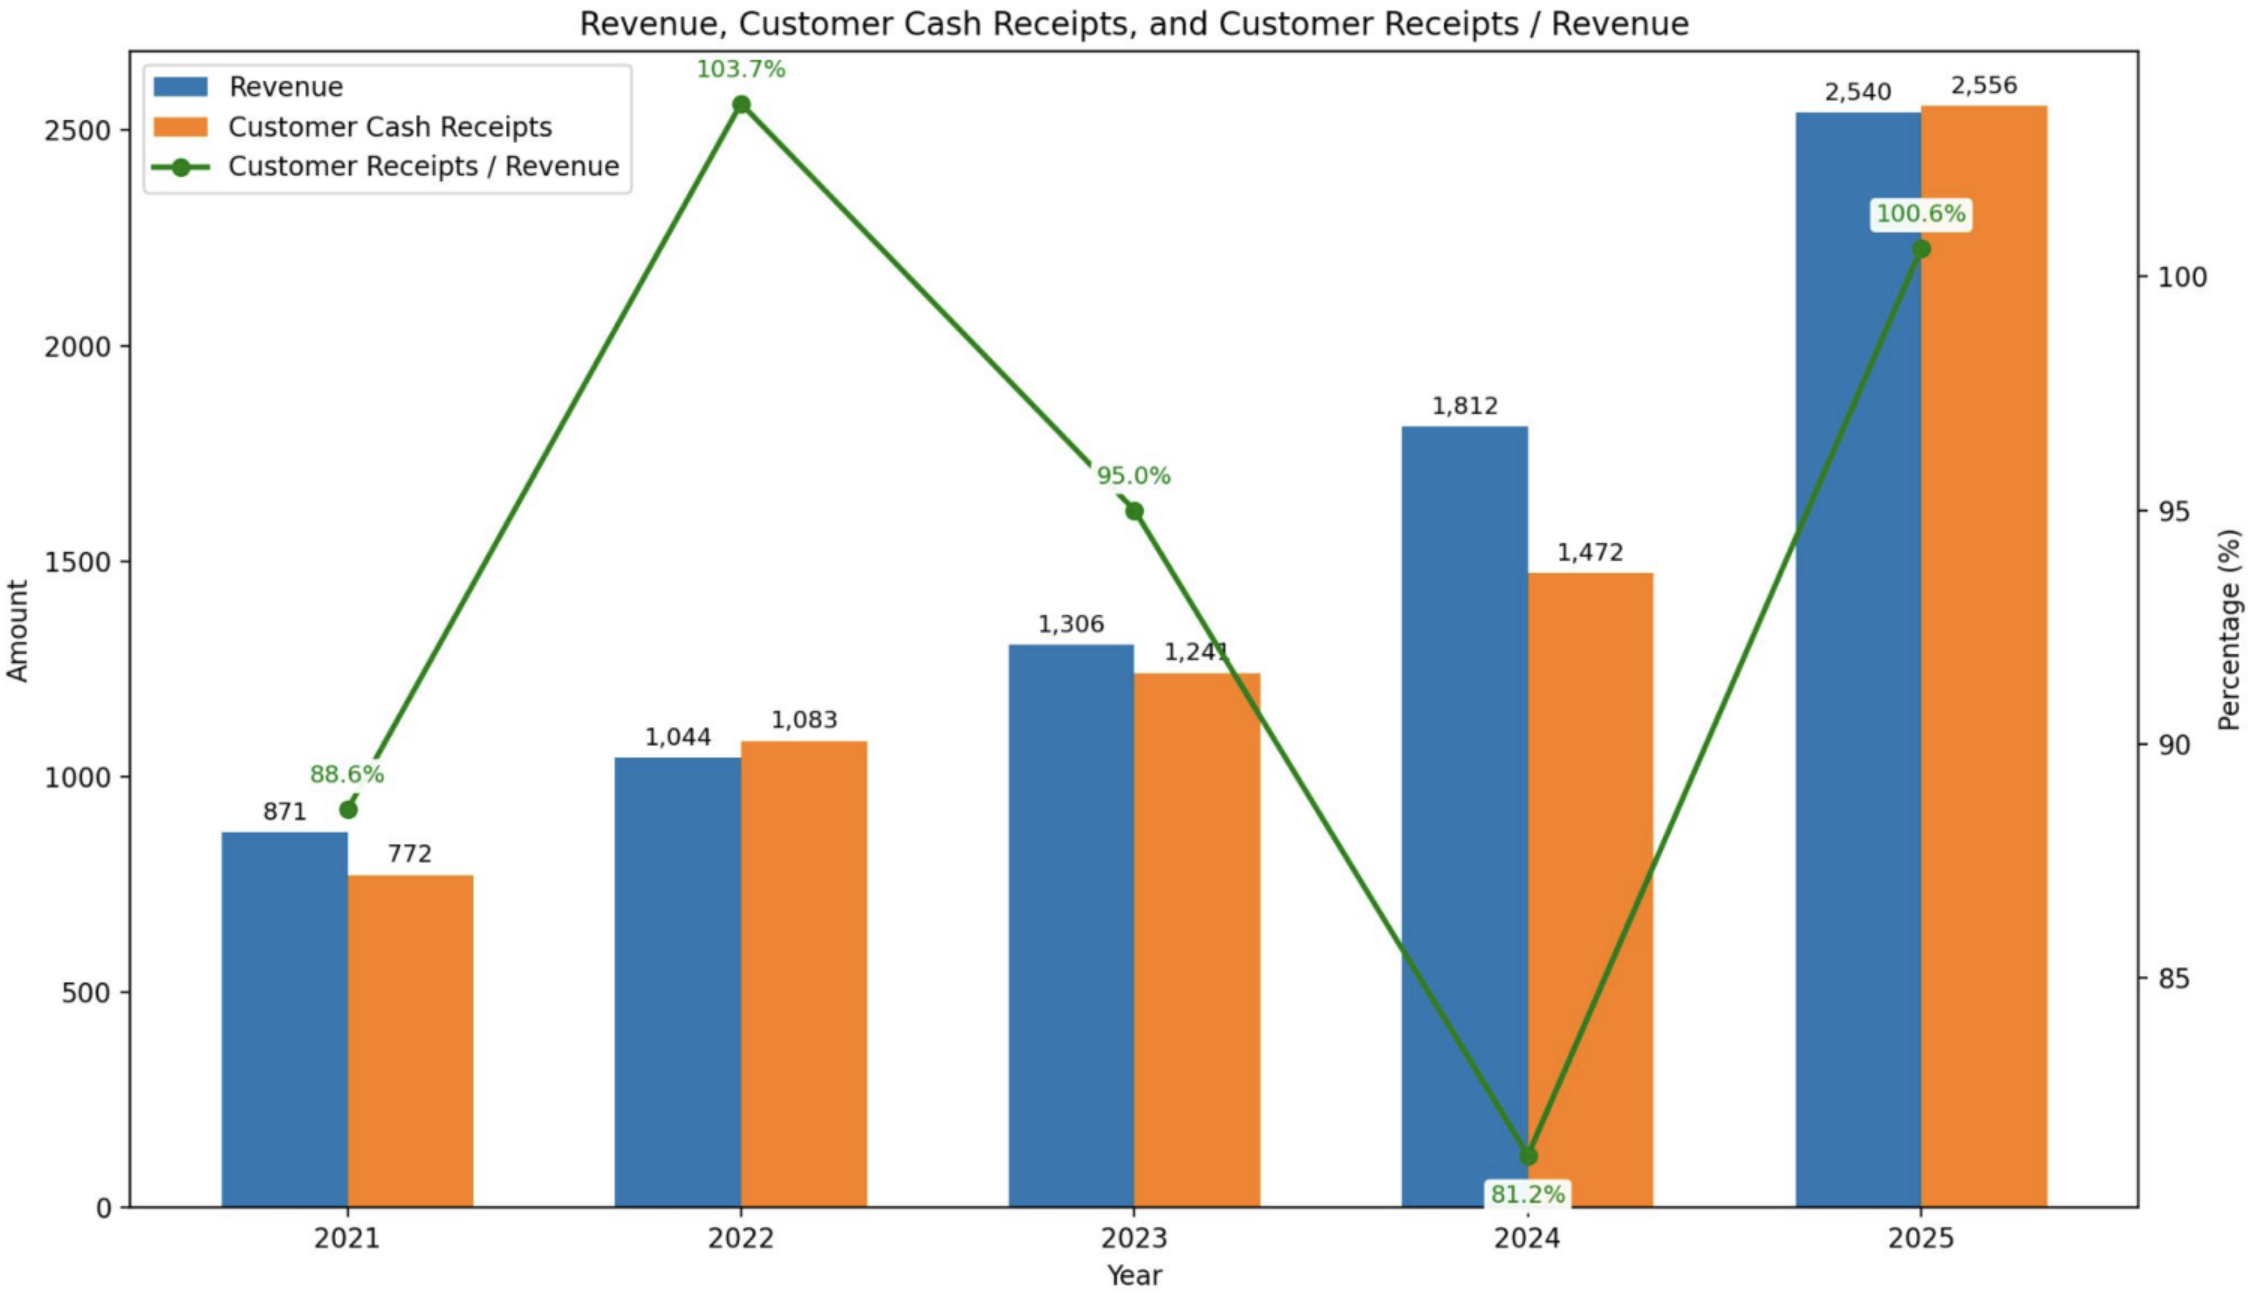 Customer cash receipts/revenue shows how much of the reported revenue has actually been collected in cash from customers. DCII’s customer cash receipts generally mirror revenue, though 2024 figures need attention.
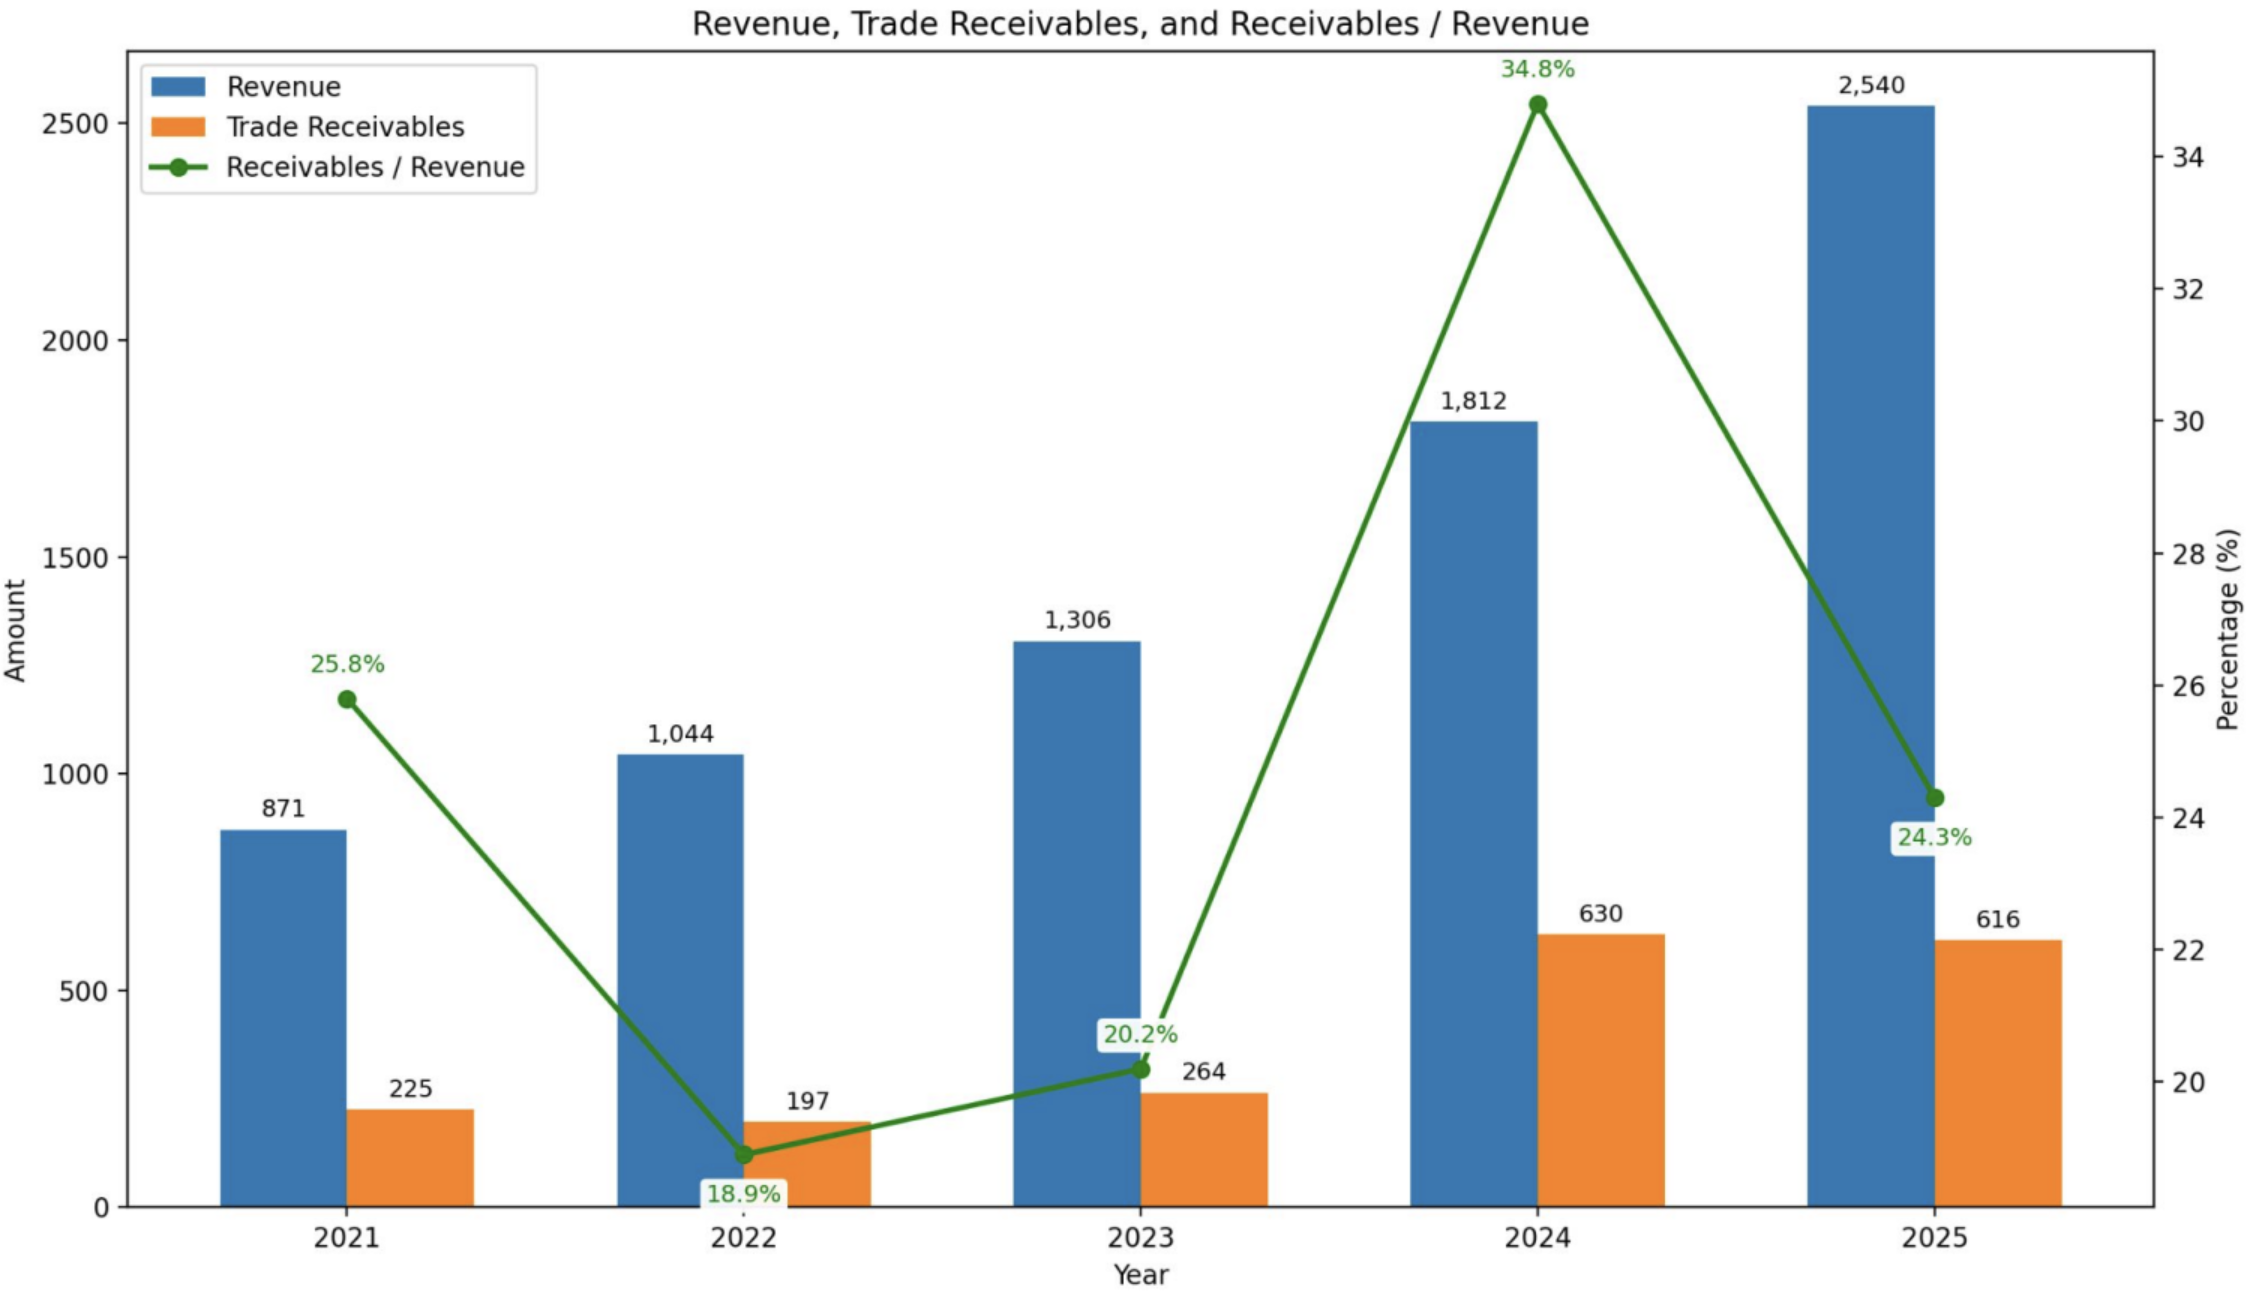 Trade receivables generally <30% of revenue except in 2024, where the number is slightly higher at 34.8. Most of the 2024 receivables were not yet past due and management shows little to no concern in the annual financial report.
3.7 DCII Financial Statement Analysis Summary

04 Future Outlook
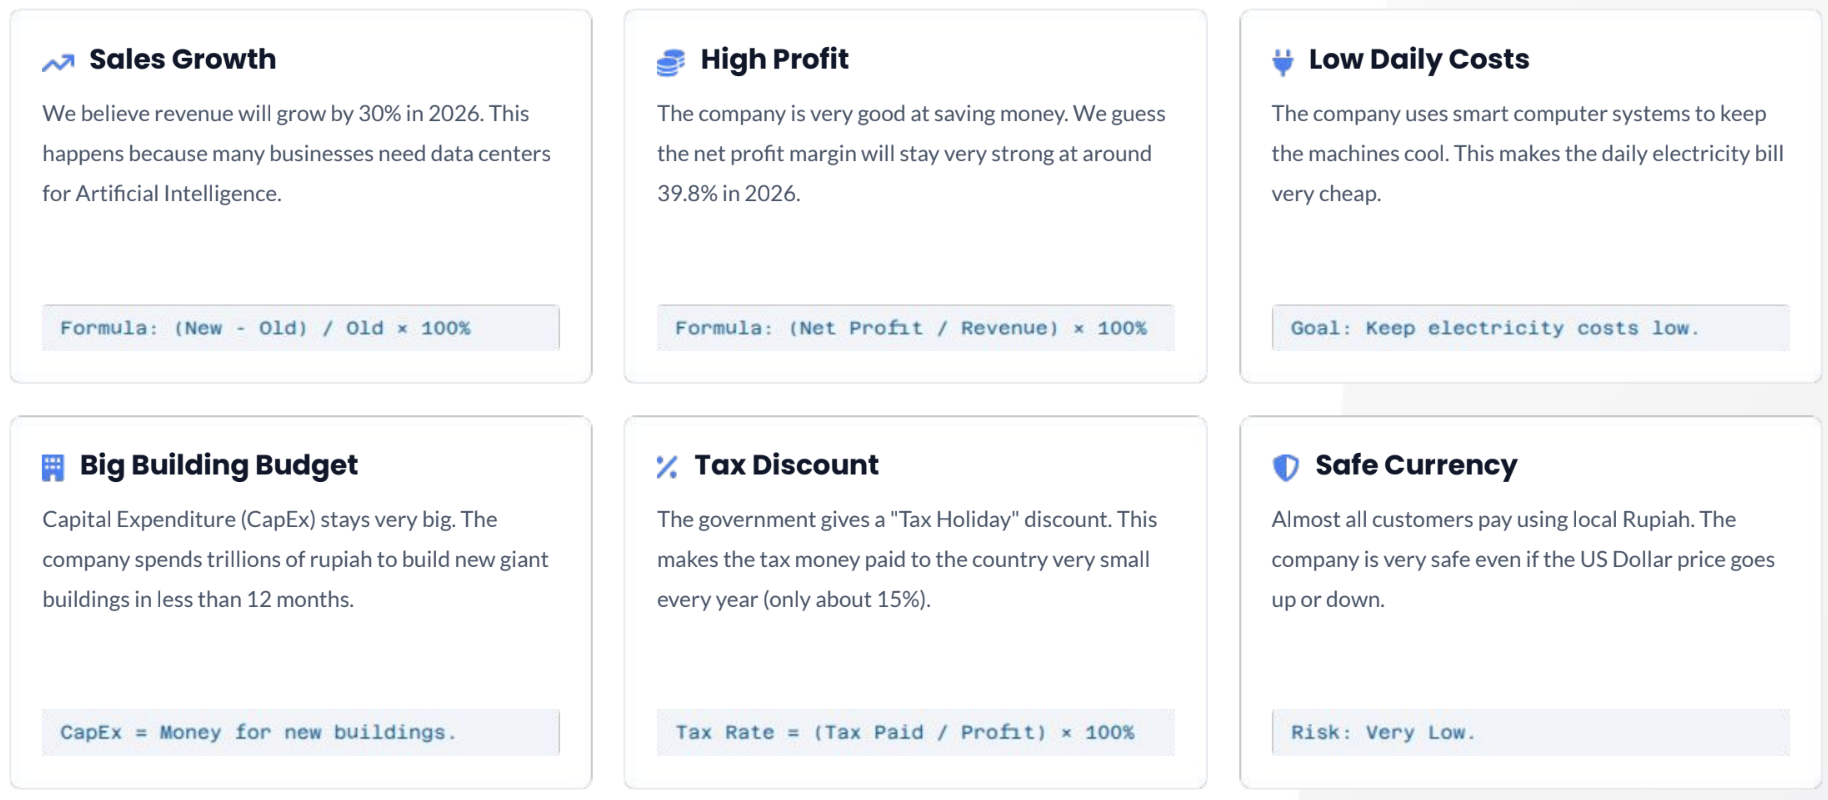
4.1 Key Assumptions
Simple logic and rules used to guess the 2026 numbers.
4.2 Income Statement
This report shows how much money the company makes from its sales.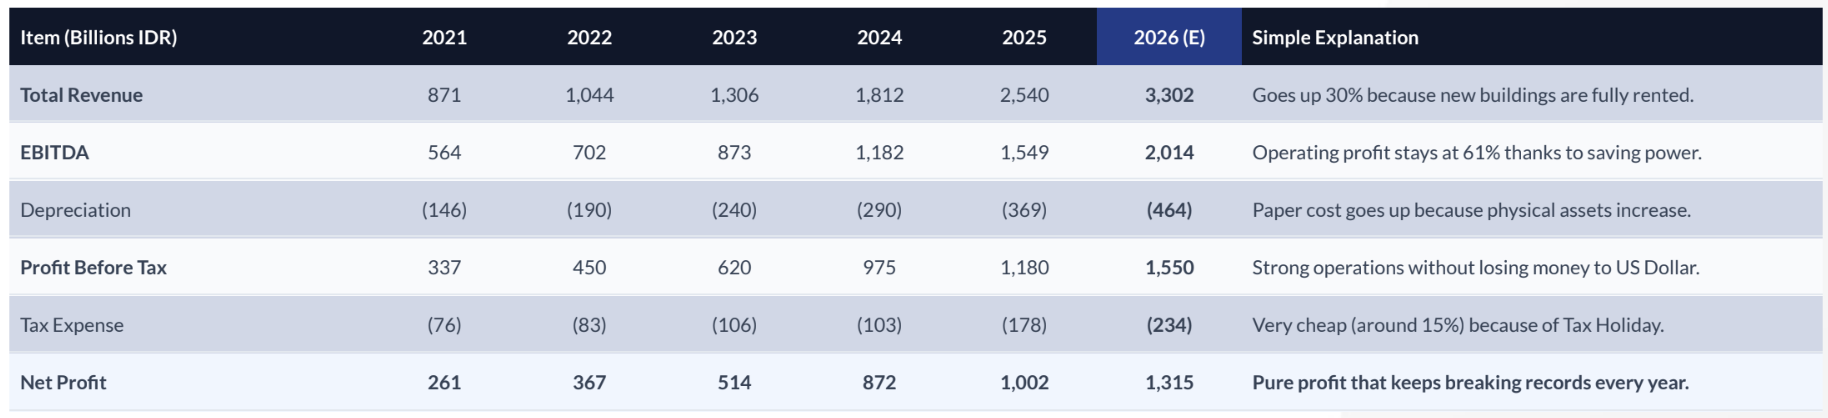 What does this mean? The company can turn physical buildings into trillions of rupiah in net profit very fast. With a projected net profit of Rp1.31 trillion, the company has great financial freedom. They do not need to borrow high-interest money from banks to grow.
4.3 Balance Sheet
This report shows everything the company owns (Assets) and owes (Debt).
 What does this mean? Total Assets = Total Debt + Total Equity. The company has a foundation as strong as concrete. Their wealth grows very big, but their debt stays small. This means they are extremely safe from bankruptcy.
4.4 Cash Flow
This report tracks exactly where real cash comes in and goes out.
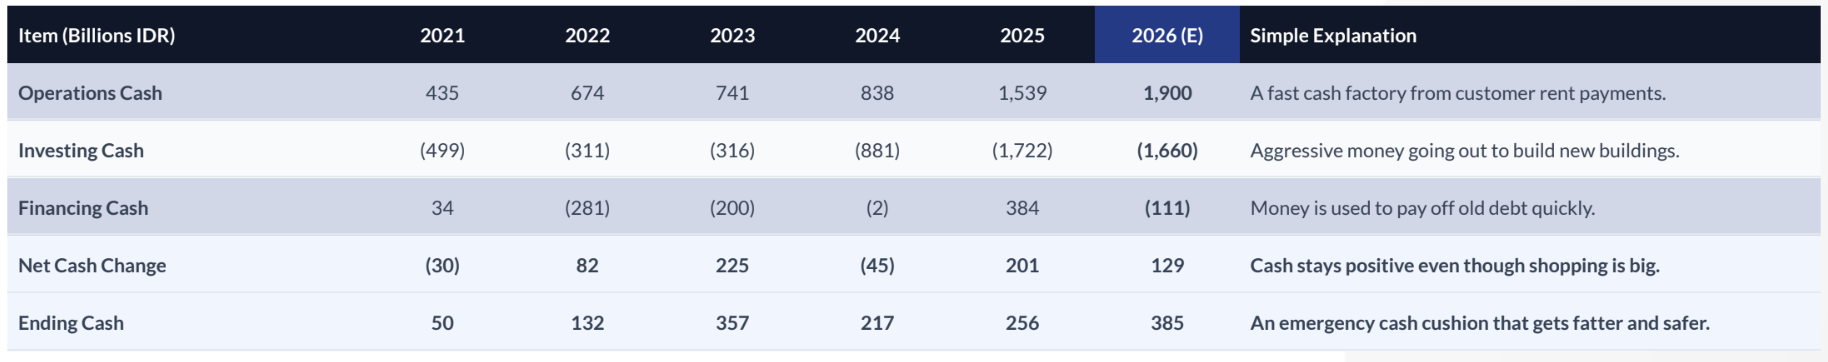 What does this mean? A negative number in “Investing Cash” is very good. It means the company is aggressively buying weapons to grow bigger. Because the cash from operations is so huge, they can pay for trillion-rupiah projects using their own money.
4.5 Financial Ratios
These are the final “report card” scores to see if the company is healthy.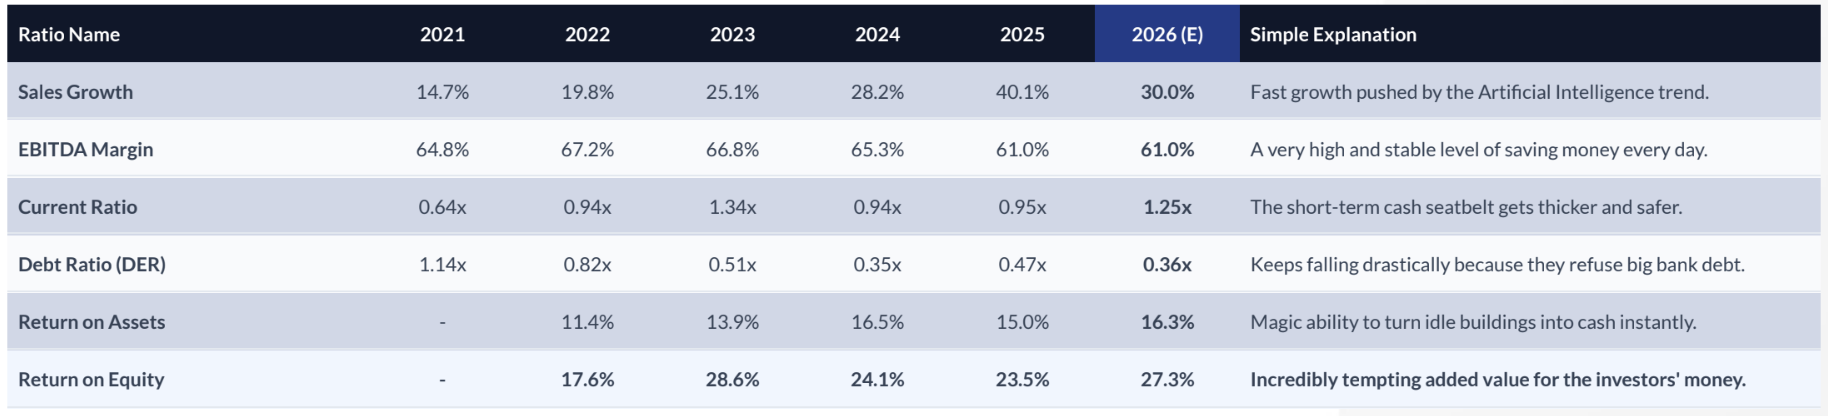
Comments :