Avian Brands: The Paint Giant That Got Its IPO Right
PT Avia Avian Tbk (AVIA.JK) raised Rp5.76 trillion in 2021. Four years on, its financials tell a story of genuine operational strength — but its stock price tells a more complicated one.
 Nitolonia Fernando Lifao
MBA Candidate · Binus Business School · Student ID: 2602656445
Individual Paper for Corporate Finance · May 2026 · 12 min read
In a market landscape where IPO hype often outpaces operational reality, PT Avia Avian Tbk — known under its consumer brand Avian Brands — stands as an instructive outlier. Established in 1983 and headquartered in East Java, the company went public on the Indonesia Stock Exchange (IDX) in December 2021, raising Rp5.76 trillion at Rp930 per share. Four years on, its financials tell a story of genuine profitability and sound capital management — even as its stock has struggled to reclaim its IPO-day highs.
This article traces AVIA’s journey from a leading domestic paint manufacturer to a publicly listed company, examining its IPO objectives, the deployment of proceeds, post-IPO financial performance, stock price trajectory, and what all of it means for investors evaluating the stock today.
1. Company Overview
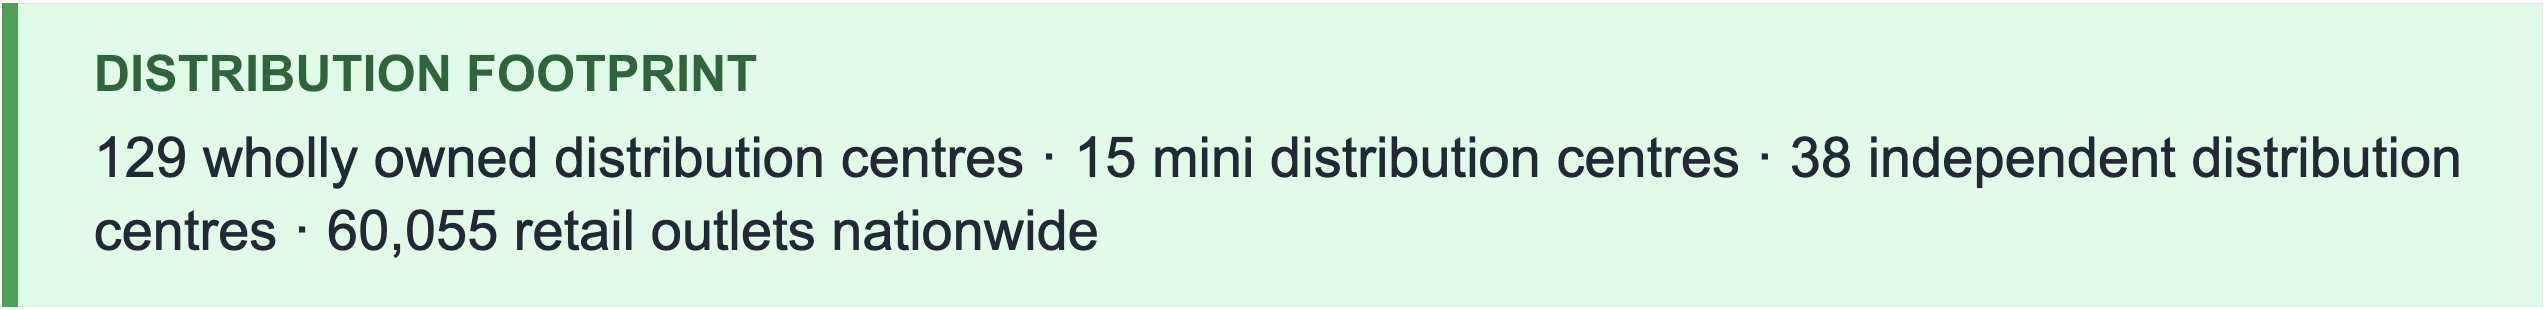
PT Avia Avian Tbk is one of Indonesia’s most established paint manufacturers, with more than four decades of industry experience. The company’s product portfolio spans over 2,600 SKUs across architectural paints, wood and metal coatings, waterproofing solutions, printing inks, varnishes, adhesives, and ready-mixed concrete products. Its nationwide distribution network covers more than 60,000 retail outlets across Sumatra, Java, Kalimantan, Sulawesi, and beyond — a reach few domestic competitors can match.
As of December 2025, Avian Brands operates through five key entities. PT Tirtakencana Tatawarna (TKTW, 99.99% owned) serves as its primary retail distributor and building products trader. PT Solusi Rumah Praktis (SRP, 99.99% owned) handles retail paint trade and painting services. PT Multipro Paint Indonesia (MPI, 67.00%) expanded the group into protective and marine coatings but has since ceased operations as of December 2025. PT Tirtakencana Batamindo (TKBI, 99.98% indirect) strengthens market penetration in Western Indonesia via Batam. And PT Bangun Bersama Solusindo, a joint venture (50.00%) with the Saint-Gobain Group, targets the wholesale cement and waterproof paint segment.
From a governance perspective, Avian Brands has a concentrated but transparent ownership structure. PT Wahana Lancar Rejeki and PT Tancorp Surya Sentosa are the main controlling shareholders, with the Tanoko family (Wijono, Hermanto, and Ruslan Tanoko) as ultimate beneficial owners. Public shareholders collectively hold approximately 16.33%, with no single public holder exceeding a 5% stake.
2. IPO Objectives & Proceeds
AVIA’s IPO in December 2021 was one of Indonesia’s larger listings of the year. The company issued 6.2 billion new shares at Rp930 per share, generating gross proceeds of approximately Rp5.766 trillion. The funds were allocated across four strategic buckets, each with clearly articulated purposes in the company’s prospectus.
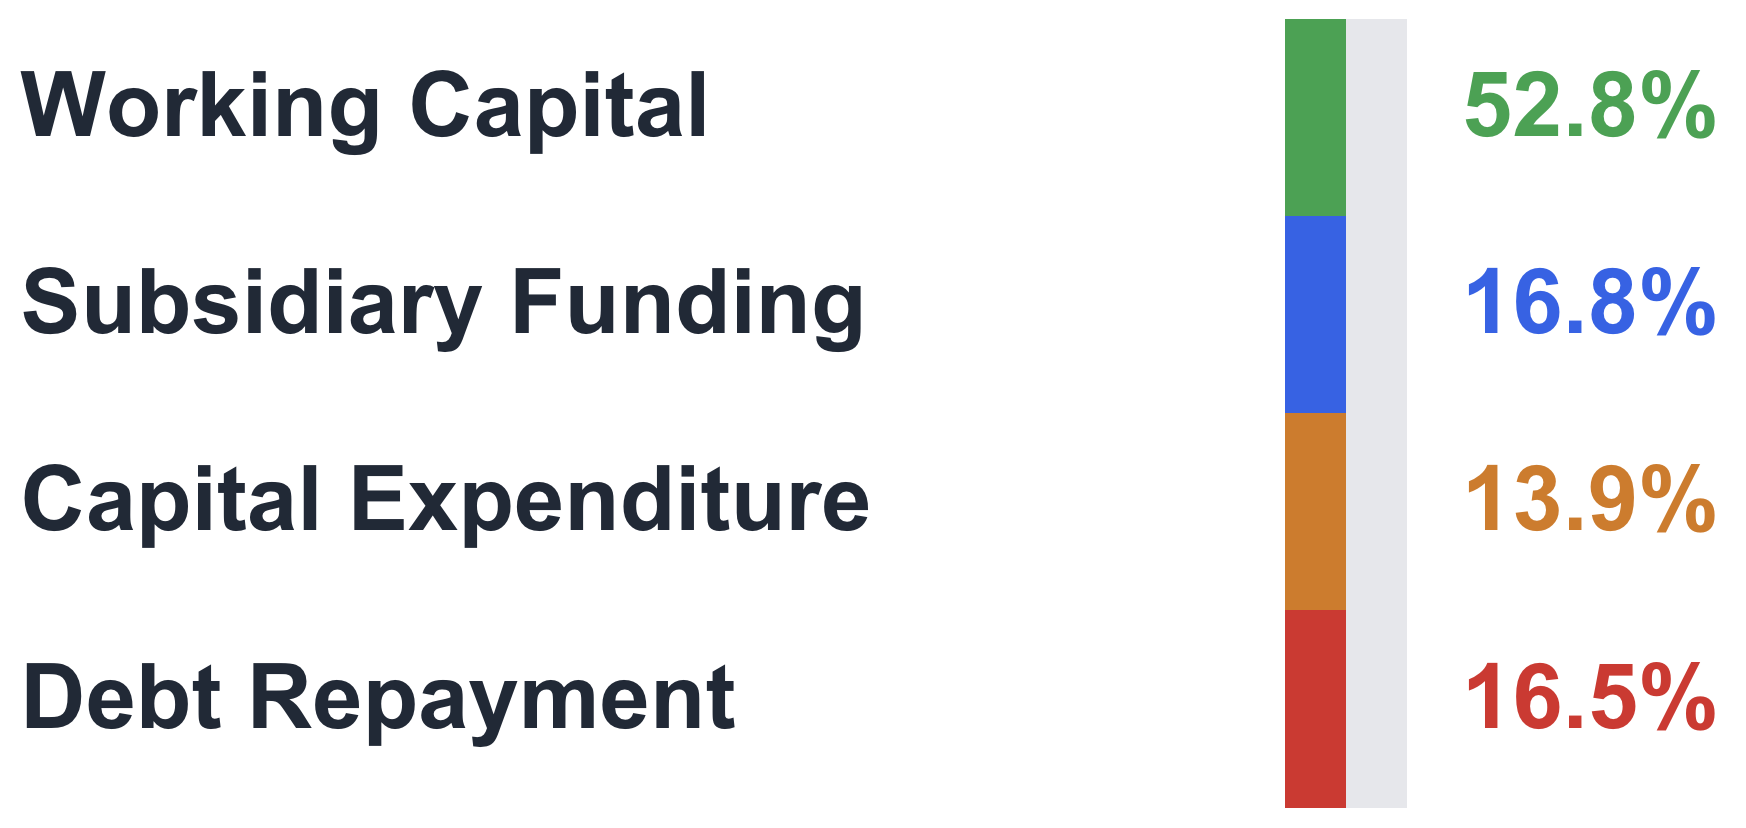 Figure 1 · IPO Proceeds Allocation — AVIA (Source: IPO Prospectus, 2021)
Working Capital — 52.8%
The largest portion — Rp2.97 trillion — was earmarked for the parent company’s day-to-day operations: purchasing raw materials, managing inventory, and sustaining operational continuity. This has been fully deployed by end-2025.
Subsidiary Funding — 16.8%
Approximately Rp950 billion was channelled to PT Tirtakencana Tatawarna (TKTW) via capital injection, supporting the subsidiary’s working capital — supplier payments, inventory procurement, and operational expenses. This too has been fully realized.
Capital Expenditure — 13.9%
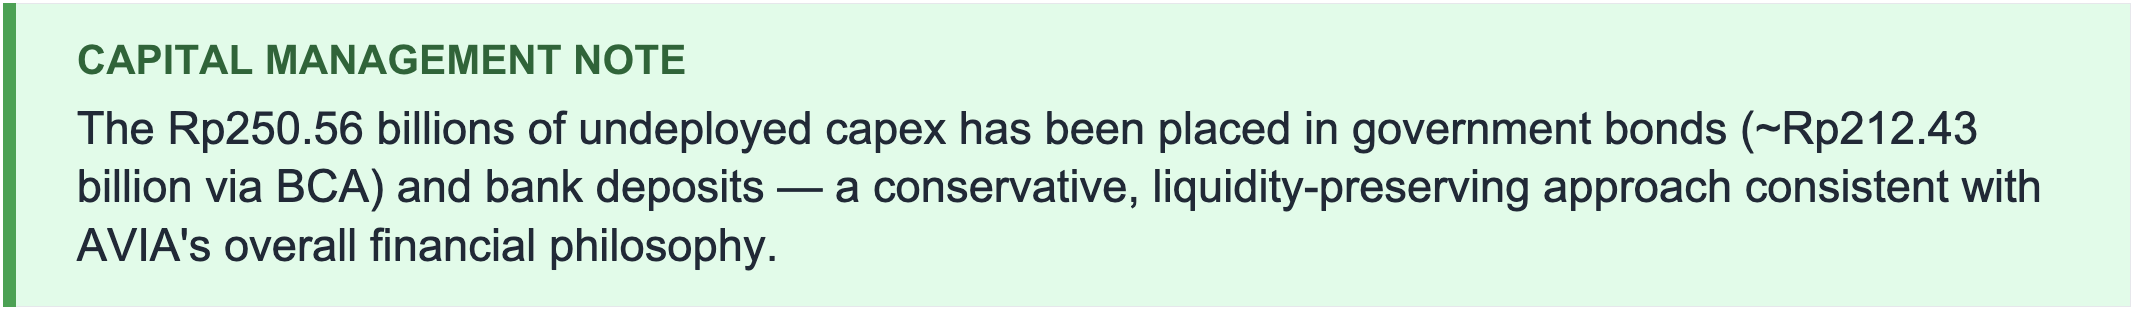
Rp702.14 billion was designated for expansion over 2022–2024, including the development of a third manufacturing facility in Cirebon, upgrades to existing plants, machinery procurement (filling machines, mixers, reactors, tanks), infrastructure maintenance, and IT systems. As of end-2025, Rp451.57 billion has been realized, leaving Rp250.56 billion for ongoing investments.
Debt Repayment — 16.5%
Rp550 billion was used to repay bank loans at both parent and subsidiary levels, reducing financial leverage and strengthening the balance sheet ahead of the company’s growth phase. This has been fully executed.
3. Post-IPO Financial Performance
AVIA’s post-IPO financial track record is genuinely strong — particularly when compared with many Indonesian small-cap listings. Revenue has grown consistently, profitability has remained healthy, and cash generation has been reliable. The main areas of concern are efficiency metrics and the translation of top-line growth into bottom-line expansion.
Revenue & Profitability
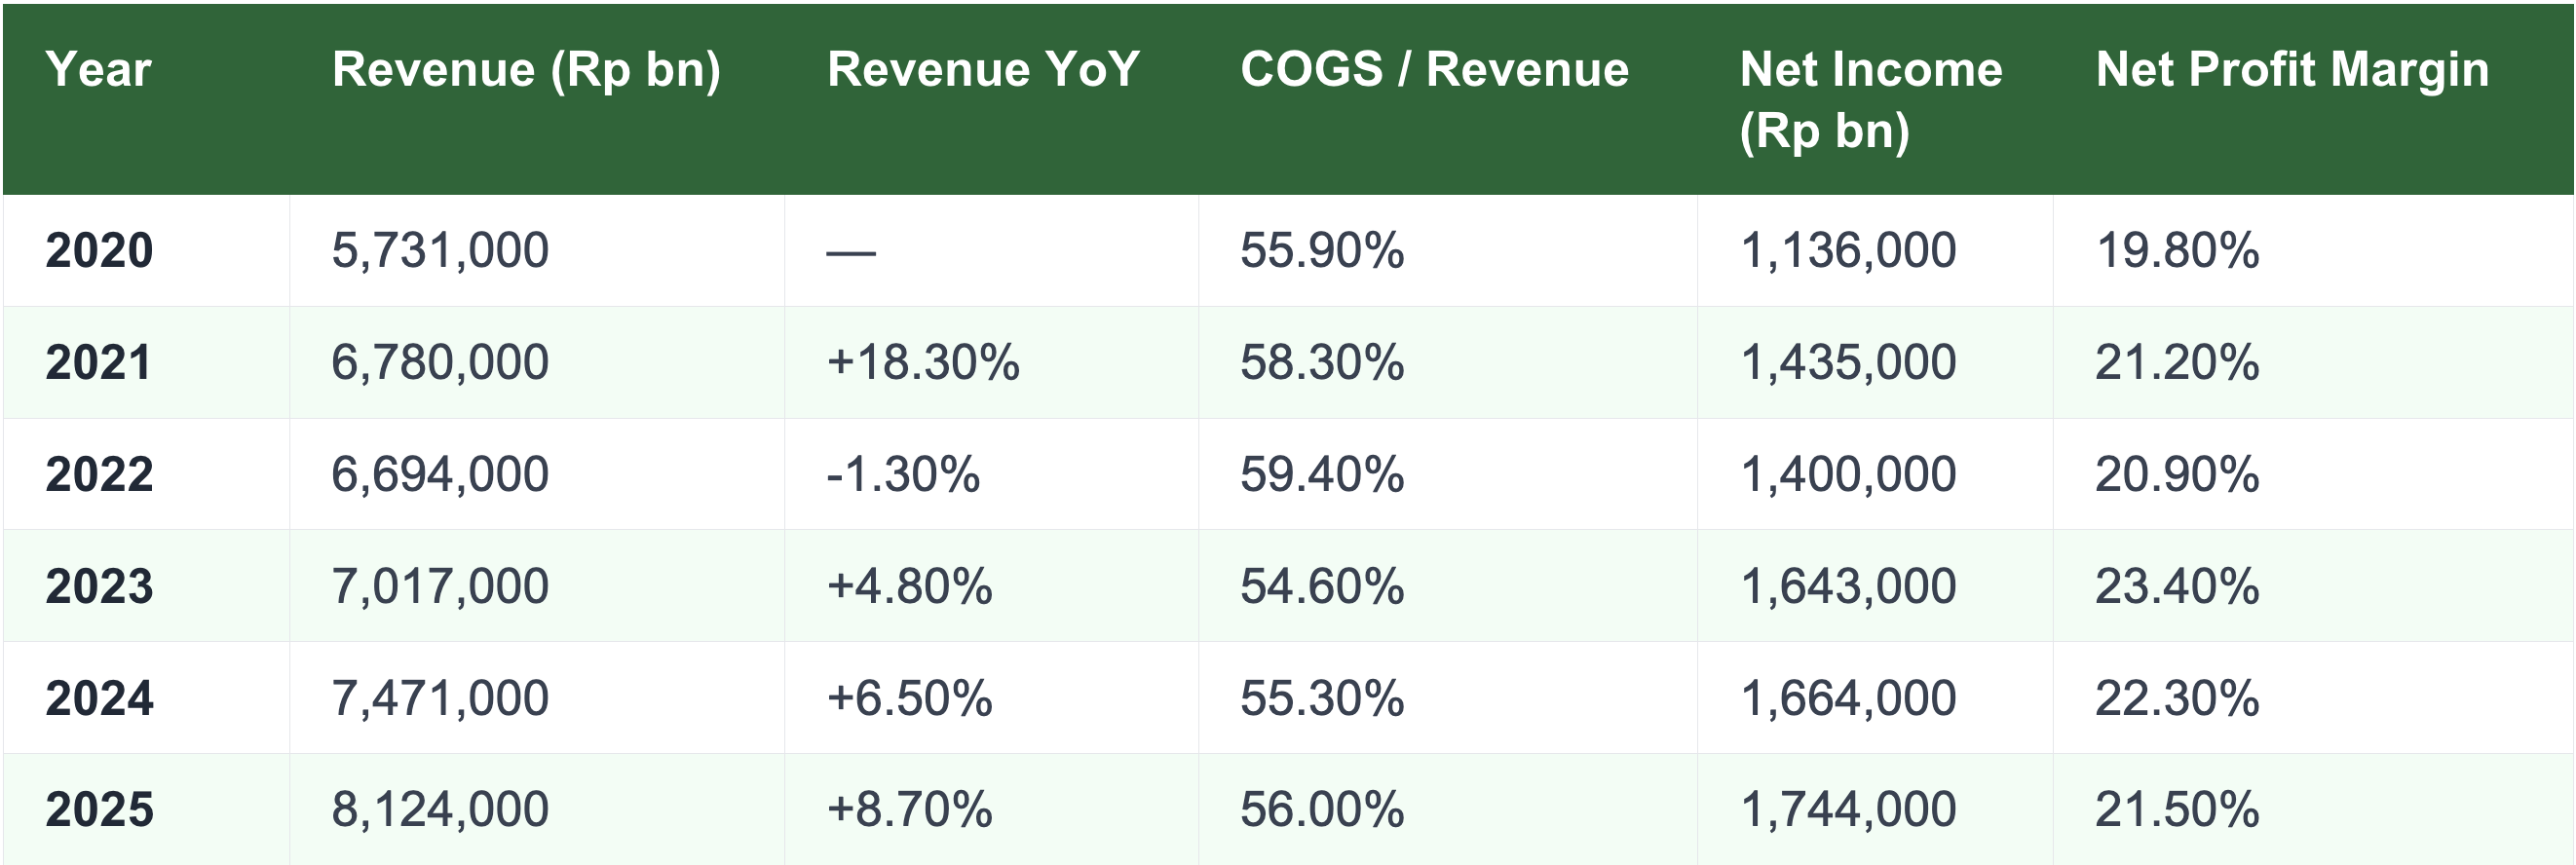 Table 1 · Revenue & Profitability Summary, 2020–2025 (in million IDR) (Source: Stockbit, 2026)
Revenue contracted slightly in 2022 (-1.30% YoY) — the first full year after the IPO — likely reflecting post-listing integration costs and market normalization. From 2023 onward, however, growth re-accelerated impressively: +4.80% in 2023, +6.50% in 2024, and +8.70% in 2025. This trajectory reflects the effectiveness of capex deployment and working capital utilization funded by the IPO.
Net profit margins have held consistently above 20% throughout the period — a threshold widely regarded as indicative of strong business quality. The peak margin of 23.40% in 2023 coincided with a sharp improvement in COGS efficiency (down to 54.60% of revenue). However, the subsequent rise in COGS ratio to 56.00% by 2025 has introduced some margin pressure, moderating net income growth to 4.80% YoY in 2025.
Return on Equity
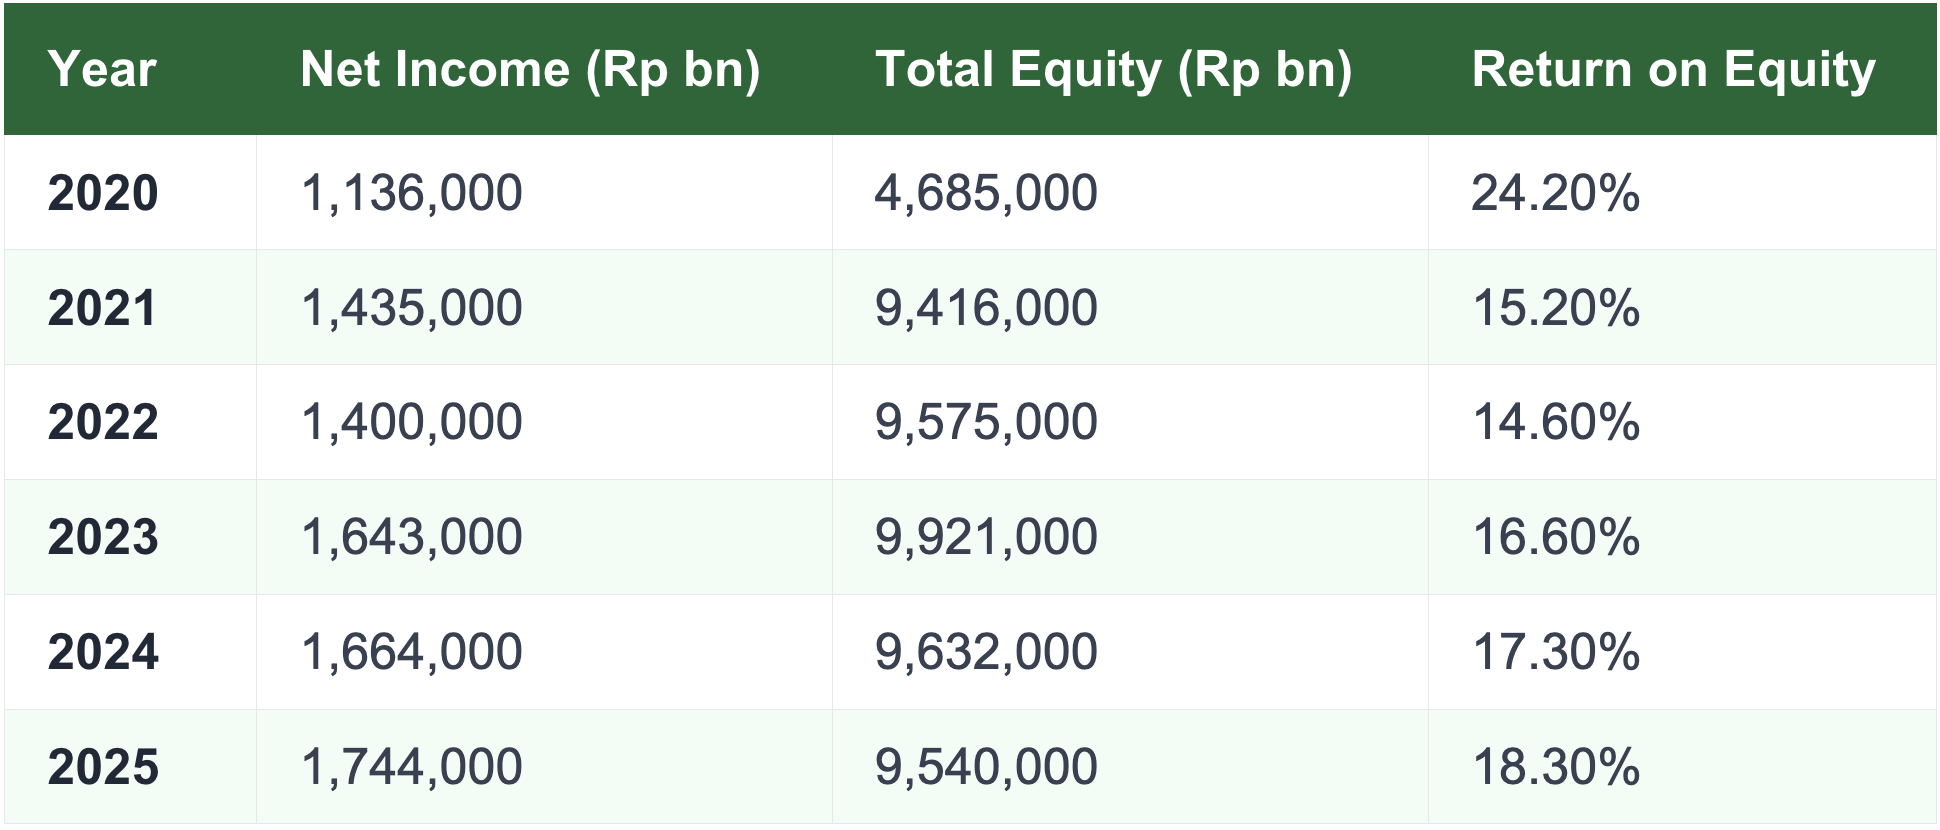 Table 2 · Return on Equity, 2020–2025 (Source: Company Annual Reports)
ROE dropped sharply from 24.20% pre-IPO to 15.20% in 2021 — a predictable consequence of the large equity infusion from the IPO. Since then, the company has steadily recovered ROE to 18.30% by 2025, approaching the pre-IPO level. This recovery trajectory reflects improving earnings power against a now-expanded capital base.
Balance Sheet & Liquidity
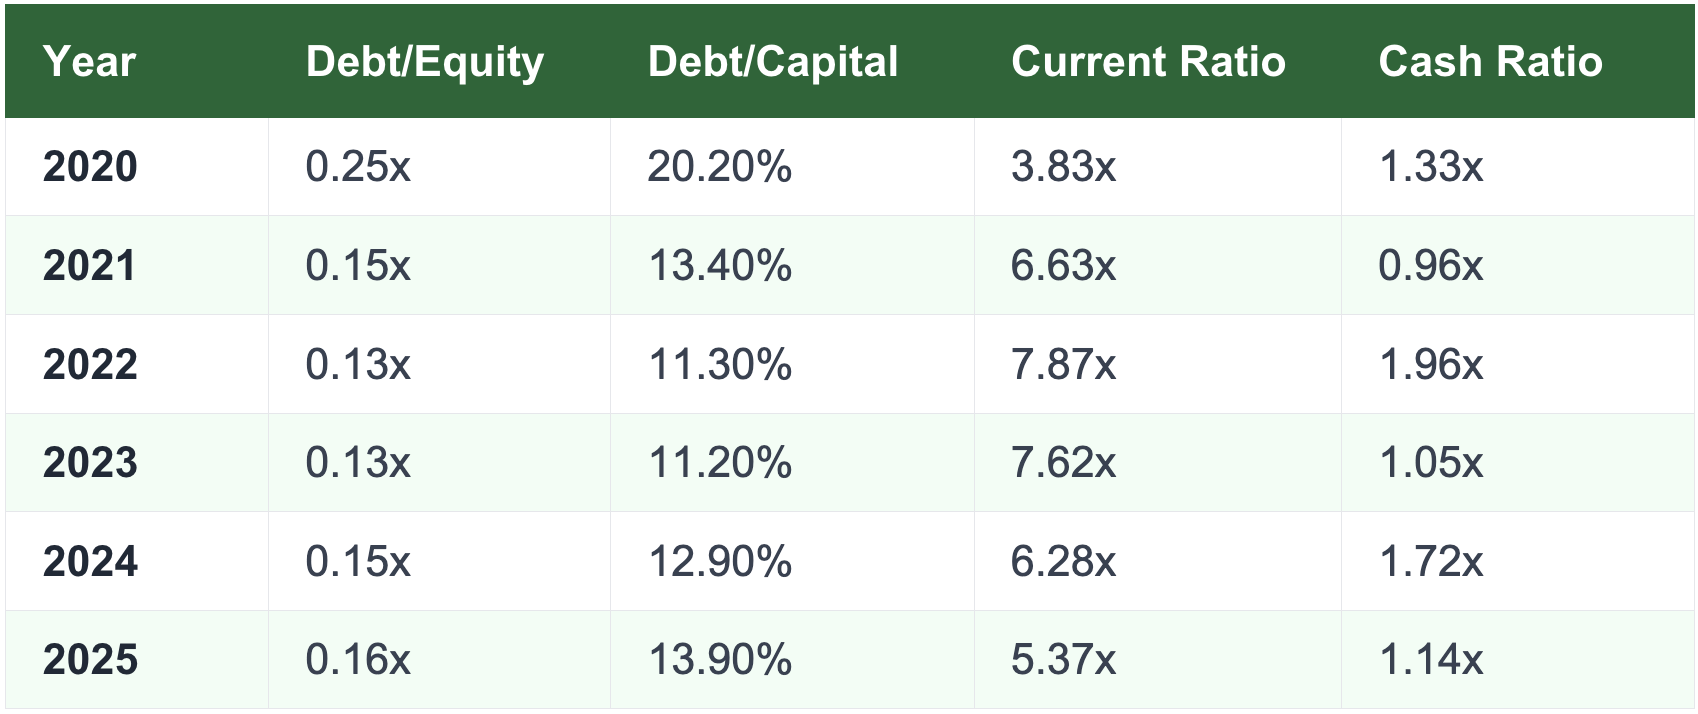 Table 3 · Balance Sheet Ratios, 2020–2025 (Source: Company Annual Reports)
AVIA’s balance sheet is conservatively structured. Post-IPO debt repayment drove the Debt-to-Equity ratio down to 0.13x — well below the 1.0x benchmark — and it has stayed in the 0.13x–0.16x range since. The Current Ratio peaked at 7.87x in 2022 and has moderated to 5.37x in 2025, still substantially above the typical 1.5x minimum. While this signals exceptional liquidity, it also raises a legitimate question: is the company holding too much idle capital that could otherwise be deployed for higher returns?
Cash Flow Quality
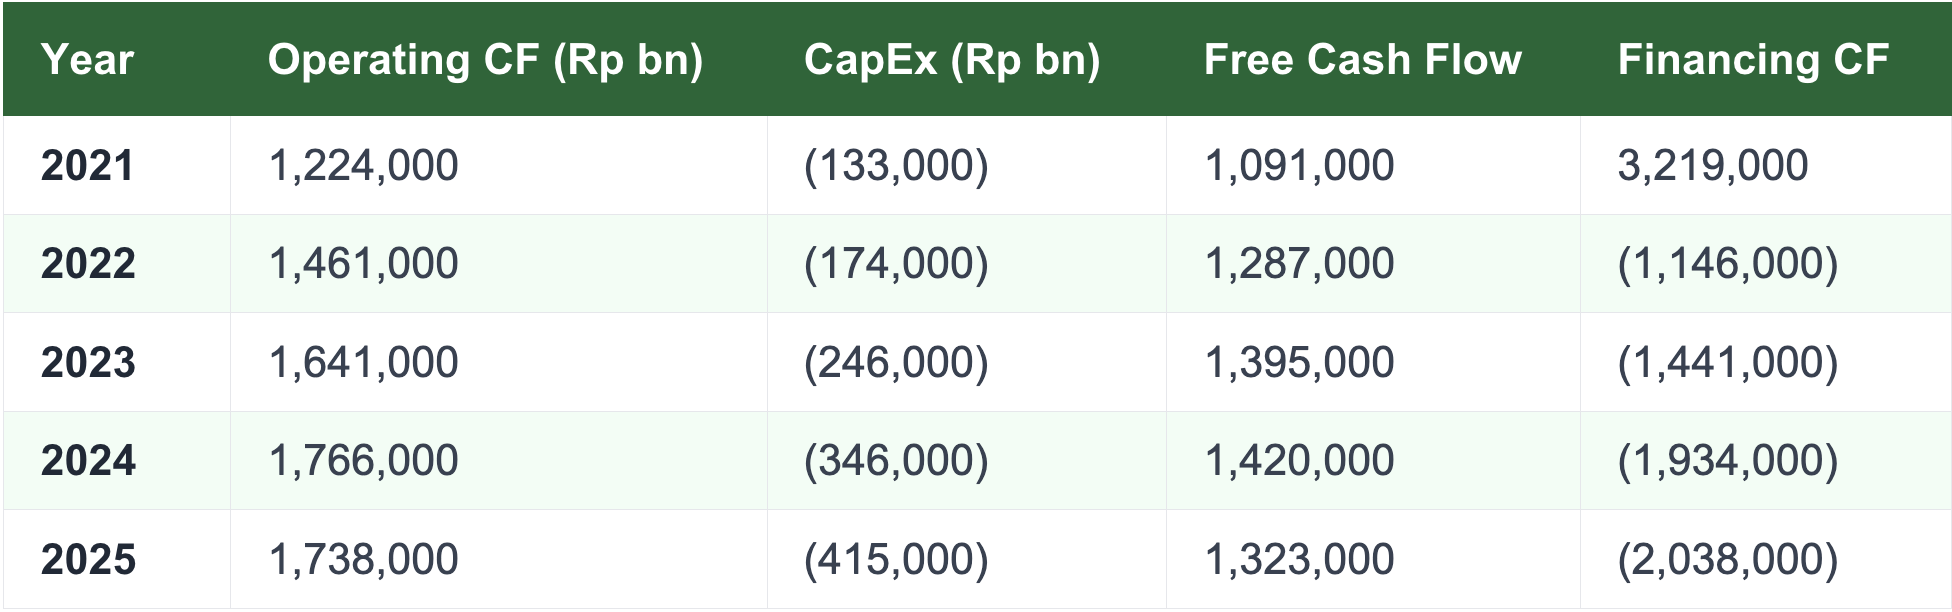 Table 4 · Cash Flow Summary, 2021–2025 (in million IDR) (Source: Company Annual Reports)
Free cash flow has been consistently positive across the entire period — a strong indicator of operational health. Operating cash flow closely tracks net income in most years, confirming that reported profits are backed by real cash generation rather than accounting adjustments. Post-IPO (2022–2025), financing cash flows have turned strongly negative, reflecting growing dividend payouts and share buybacks — a clear signal of management’s commitment to returning value to shareholders.

4. Stock Price Behaviour
AVIA’s stock price trajectory since listing reveals a classic post-IPO pattern: an initial period of strong demand followed by a sustained correction as market enthusiasm re-calibrated to fundamental realities.
Shares opened at Rp930 on listing in December 2021. Throughout 2022, the stock entered a clear bearish trend — each successive peak lower than the last, each trough deeper. High volume at the early peaks suggests distribution by institutional investors who had participated in the IPO. Dividend payments caused technical price adjustments, but the broader decline significantly exceeded dividend-driven drops, pointing to a sustained shift in market sentiment rather than mechanical corrections.
Looking at the five-year picture, the stock has not recaptured its 2021 highs. Recent price action (2024–2026) has been largely sideways at lower levels — suggesting some stabilization, but no clear evidence of a meaningful recovery trend. The technical picture remains cautious.
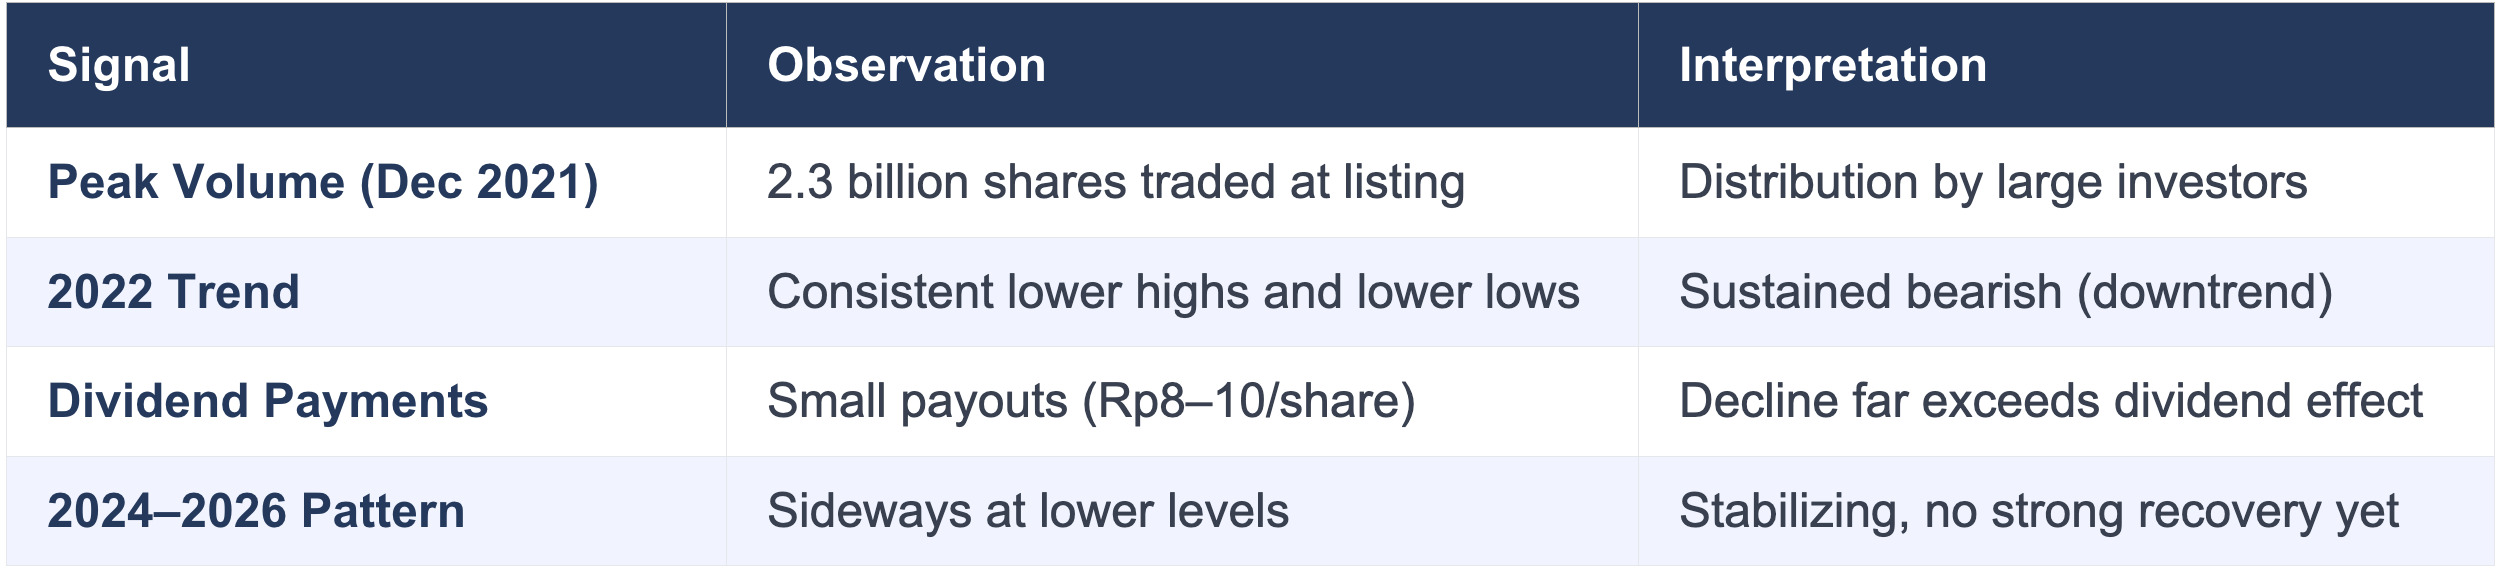 Table 5 · AVIA.JK Technical Market Signals Summary
5. Decision Analysis: Hold, Buy, or Wait?
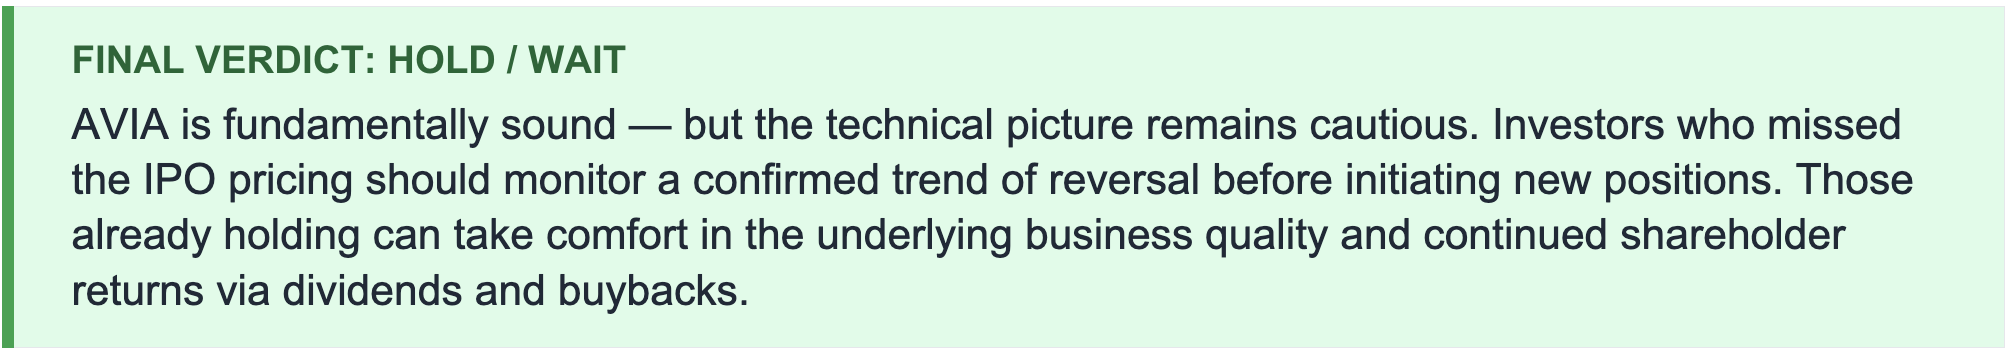
A balanced assessment of AVIA must reconcile two distinct realities: fundamentally, this is a well-managed, profitable, cash-generative business with strong market positioning; technically, its stock has been in a downtrend for over three years with no confirmed reversal signal.
 Table 6 · Decision Analysis: Pros vs. Cons for AVIA Investors
The fundamental case for AVIA is genuinely compelling. Revenue is growing at an accelerating pace, margins are healthy, cash is real, and the balance sheet is fortress-like. The company has demonstrated the ability to deploy IPO capital into operational improvements and return surplus cash to shareholders. For a long-term investor focused on business quality, AVIA checks most boxes.
The technical case, however, counsels patience. The stock’s sustained downtrend since 2022, high-volume distribution at the peak, and sideways movement in 2024–2026 suggest that the broader market is still re-pricing the stock after IPO-era enthusiasm faded. A re-entry point is more likely to emerge after a confirmed trend reversal — not before it.
6. Conclusion
PT Avia Avian Tbk’s IPO and post-listing performance offer a nuanced lesson for Indonesian capital market participants: capital is a necessary condition for growth, but it is not sufficient. What distinguishes AVIA is that it has used its Rp5.76 trillion in proceeds responsibly — fully deploying working capital and debt repayment allocations, progressively executing on capex, and maintaining conservative financial management throughout.
The financial outcomes validate the IPO’s strategic rationale. Revenue has grown from Rp6.78 trillion in 2021 to Rp8.12 trillion in 2025. Net profits remain above Rp1.7 trillion with margins consistently north of 20%. Free cash flow is positive in every year reviewed. The balance sheet is among the most conservative of any Indonesian listed manufacturer.
The stock price disconnect from fundamentals is real but not unusual for post-IPO periods. AVIA was priced for perfection at its listing; the market has since adjusted. For patient investors focused on business quality over short-term price action, AVIA represents a company whose fundamentals have not just held — they have improved.

References
PT Avia Avian Tbk. (2021). Prospektus Penawaran Umum Perdana Saham (IPO Prospectus). Jakarta: Indonesia Stock Exchange.
PT Avia Avian Tbk. (2025). Annual Report 2024. Surabaya: PT Avia Avian Tbk.
PT Avia Avian Tbk. (2026). Annual Report 2025. Surabaya: PT Avia Avian Tbk.
Stockbit. (2026). AVIA Financial Data and Analysis. Retrieved from https://www.stockbit.com
Warta Ekonomi. (2026). Penggunaan Dana IPO AVIA. Retrieved 2026.
Kurniawan, R. (2023). Analisis Laporan Keuangan. Jakarta: Penerbit Saham.
Brex. (2026). What is a Good Net Profit Margin? Retrieved from https://www.brex.com
Investopedia. (2026). Current Ratio Definition and Formula. Retrieved from https://www.investopedia.com
KPI Depot. (2026). Debt-to-Capital Ratio Benchmark. Retrieved from https://kpidepot.com
Xero. (2026). Cash Ratio: Definition and How to Calculate. Retrieved from https://www.xero.com
Comments :