When the IPO Bell Rings But the Growth Never Comes
A deep-dive into PT Hotel Fitra International Tbk (FITT.JK) and what Indonesia’s small-cap IPO market reveals about the gap between capital-raising ambition and operational reality.
 Aurora Poetri Gaeta
MBA Candidate · Binus Business School · Student ID: 2602650920
Individual Paper for Finance · May 2026 · 10 min read
The Initial Public Offering (IPO) is one of the most consequential strategic decisions a company can make. For investors, it represents an opportunity to participate in a company’s earliest chapter as a public entity — but also an exposure to risks that are often understated in the excitement surrounding a new listing.
This article analyses the IPO of PT Hotel Fitra International Tbk (ticker: FITT.JK), a hospitality holding company based in Majalengka, West Java, which listed on the Indonesia Stock Exchange (IDX) in June 2019. Drawing on the company’s official IPO prospectus and publicly available market data as of April 2026, we examine whether the IPO delivered on its promises — for the company and for investors.

1. IPO Objectives and Proceeds
PT Hotel Fitra International Tbk established its effective IPO date on May 27, 2019, with the public offering window running May 28–29 before shares officially listed on the IDX on June 11, 2019. The company offered 220 million new shares — representing approximately 36.67% of post-IPO capital — at a price of IDR 102 per share, generating gross proceeds of IDR 22.44 billion.
Underwriting was handled by PT Lotus Andalan Sekuritas on a full-commitment basis. Alongside the share offering, the company issued 132 million Series I Warrants at no cost to existing shareholders, at a ratio of 3 warrants for every 5 shares. Each warrant entitled the holder to purchase one new share at IDR 138, exercisable from December 2019 through June 2022 — with potential additional proceeds of up to IDR 18.22 billion if fully exercised.
 Table 1 · Key Terms of the FITT.JK IPO (Source: IPO Prospectus, 2019)
The stated objectives of the IPO were twofold: to inject equity capital into PT Bumi Majalengka Permai (BMP), its primary operating hotel subsidiary, and to enhance the company’s credibility and public accountability within Indonesia’s hospitality sector.
Proceeds were earmarked across three categories: approximately 49% (~IDR 10.99 billion) for land acquisition — specifically a 2,320 m² parcel on Jl. Siti Aminah, Majalengka Kulon under a binding purchase agreement; approximately 30% (~IDR 6.73 billion) for constructing a convention hall at Fitra Hotel; and 21% (~IDR 4.71 billion) for working capital covering maintenance, hotel supplies, and events.
2. Use of IPO Proceeds: Intent vs. Reality
Any rigorous post-IPO evaluation must ask: did the company deploy its capital effectively? Stated plans must be measured against observable outcomes. In the case of FITT.JK, the financial results tell a sobering story.
Before the IPO, the company’s financial year ending December 31, 2018 disclosed total revenue of IDR 8.07 billion, cost of revenue of IDR 4.88 billion, and a net loss of IDR 4.81 billion — a pre-IPO loss margin of -85.18%. Total assets stood at IDR 47.07 billion against total liabilities of IDR 23.43 billion.

Even if the land acquisition and convention hall were completed as planned — which cannot be verified without access to full annual reports — the financial outcomes make one thing clear: those investments have not yet generated commensurate returns. The company’s net income (TTM) stands at -IDR 6.48 billion, with a profit margin of -66.04%. Return on assets is -3.12% and return on equity is -8.63%. Levered free cash flow of -IDR 11.12 billion indicates ongoing cash burn.
The company has shown some efficiency improvement over the pre-IPO -85.18% loss margin — but the underlying picture remains one of persistent underperformance relative to the capital it raised.
3. Post-IPO Financial Performance
A rigorous post-IPO financial assessment examines whether the company achieved sustainable growth, improved profitability, and strengthened its financial position since listing. Comparing pre-IPO metrics with current trailing twelve-month (TTM) figures reveals a company that has struggled across most dimensions.
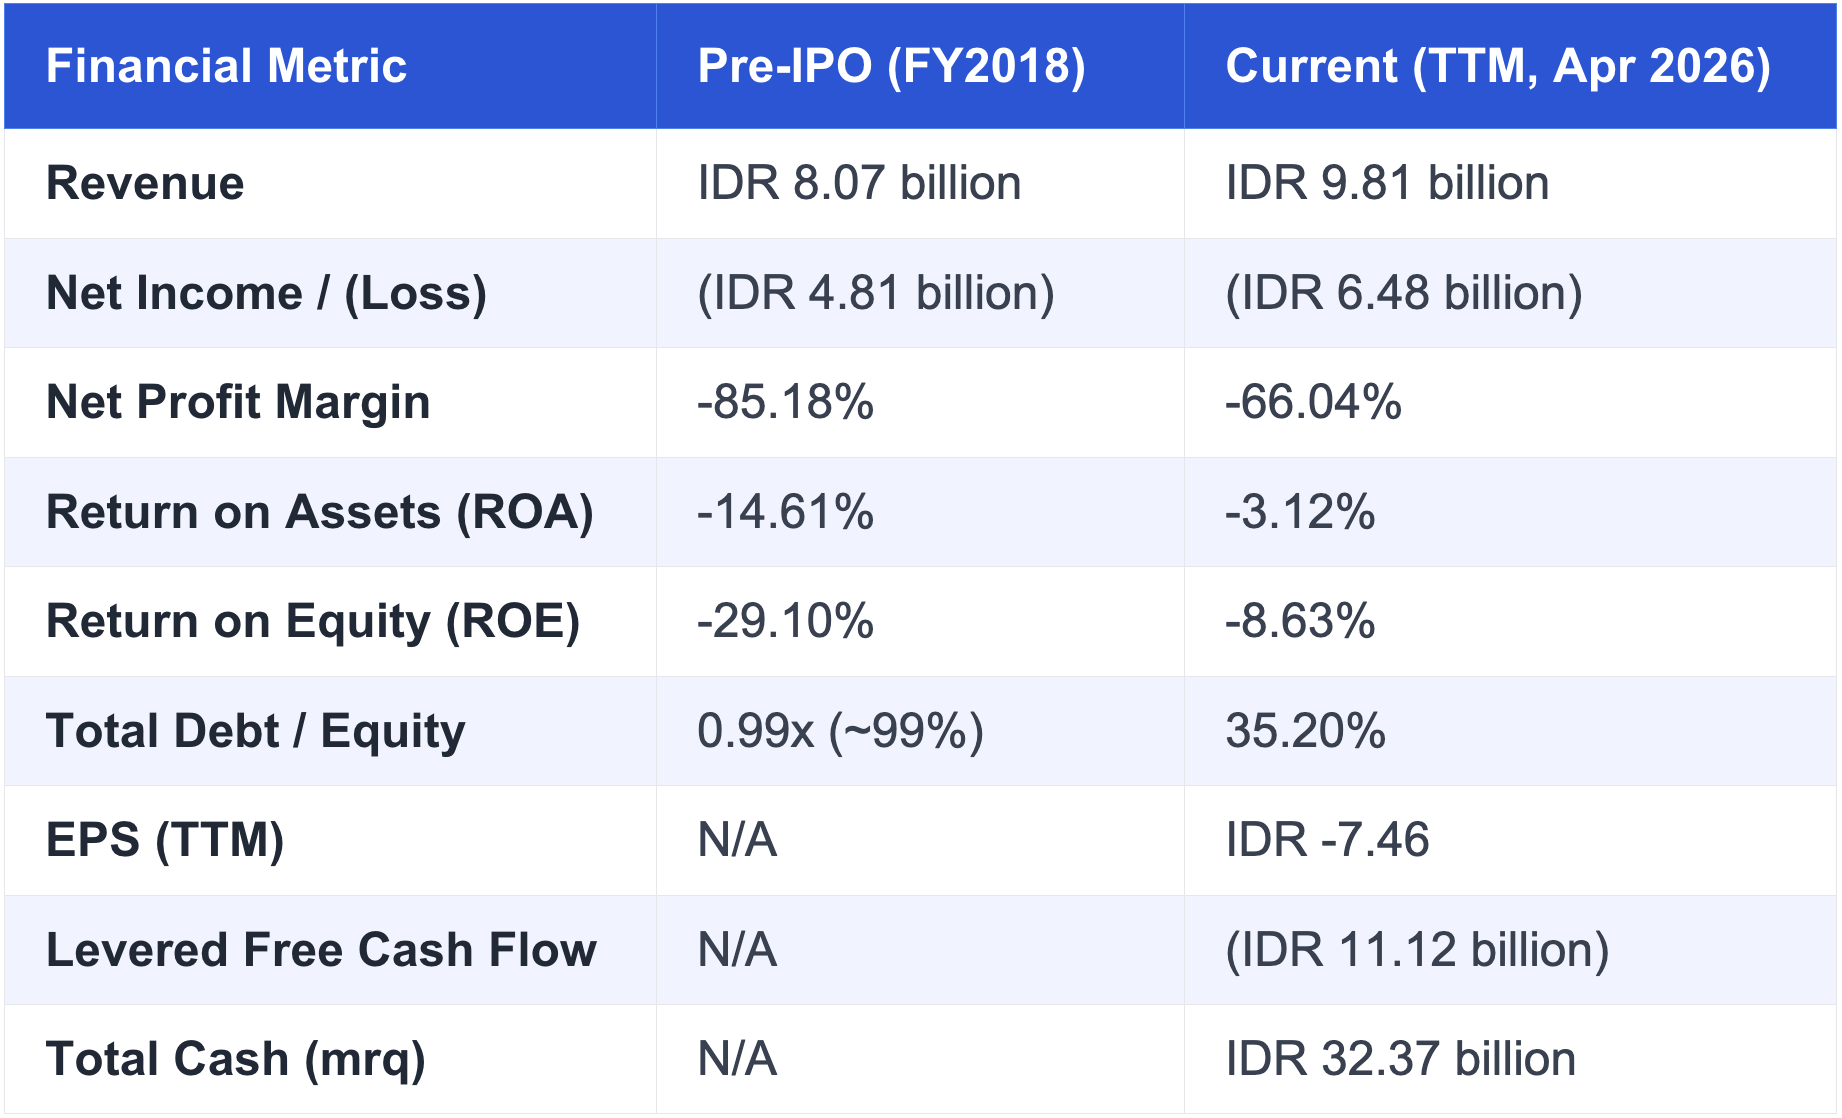 Table 2 · Pre-IPO vs. Post-IPO Financial Comparison (Sources: IPO Prospectus 2019; Yahoo Finance, April 2026)
Revenue grew from IDR 8.07 billion (FY2018) to IDR 9.81 billion (TTM 2026) — an increase of approximately 21.5% over seven years, implying an annualised growth rate of roughly 2.8%. This falls well below Indonesia’s average GDP growth rate, and far short of what would be expected from a company that raised IDR 22.44 billion to fund expansion. The convention hall, built specifically to unlock new revenue streams, has not produced a material step-up in earnings.
The company continues to record net losses exceeding IDR 6 billion annually. There is no clear visibility on a path to profitability. While some efficiency ratios have improved relative to the pre-IPO baseline, the core challenge — generating meaningful revenue from a significantly expanded asset base — remains unresolved.
4. Stock Price Behaviour and Market Signals
Stock behaviour in the years following an IPO is often the most direct measure of how the market views a company’s trajectory. The share price history of FITT.JK is a study in extreme volatility.
The stock listed at IDR 102 on June 11, 2019. As of April 23, 2026, it traded at IDR 458, having declined 5.37% on that single day from a prior close of IDR 484. Its 52-week trading range: IDR 130 to IDR 1,610 — a ratio of over 12:1, a characteristic of illiquid, speculative micro-cap stocks lacking stable fundamental valuation.
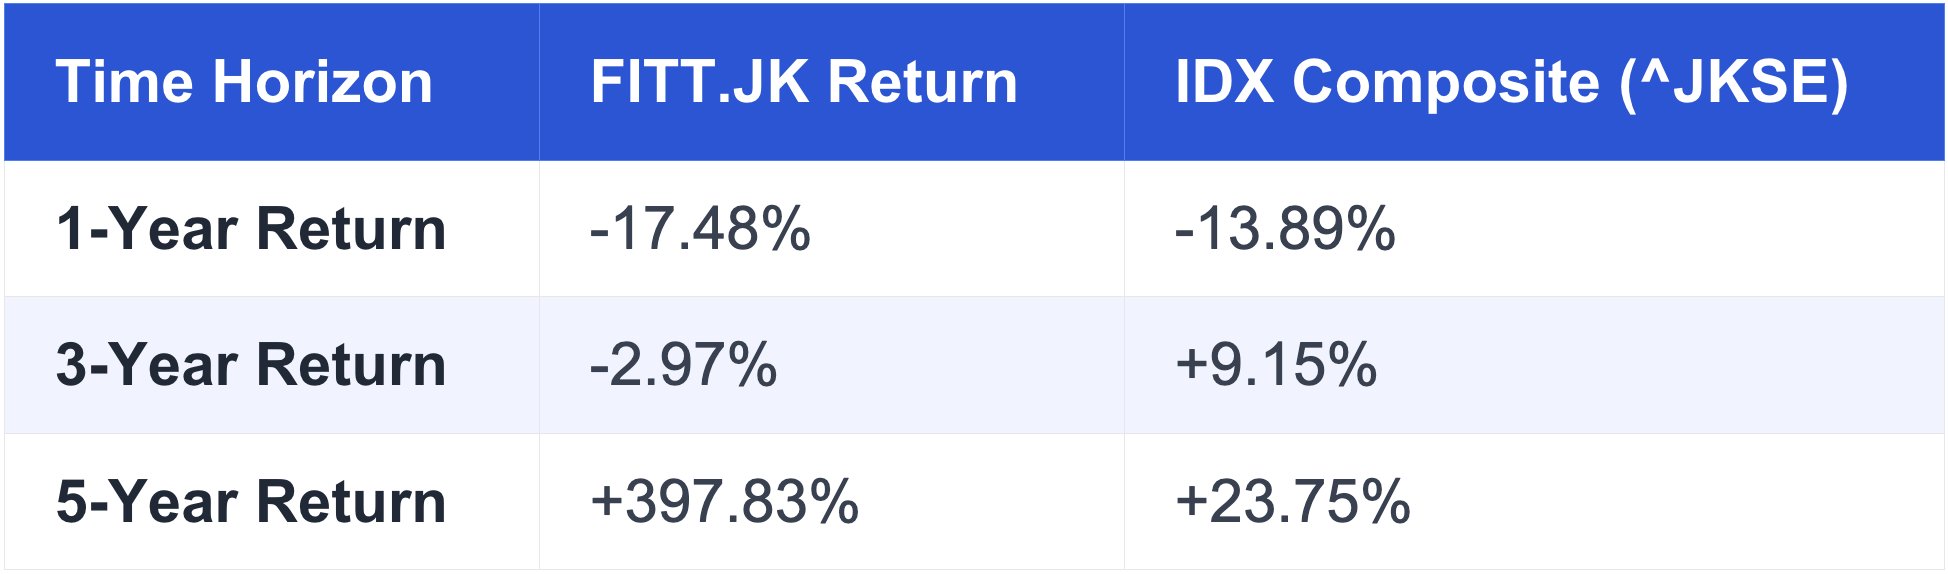
The 1-year and 3-year returns tell a more representative story than the 5-year figure. Over one year, FITT.JK returned -17.48% versus the benchmark’s -13.89% — underperforming even in a broadly declining market. Over three years, it returned -2.97% against the benchmark’s +9.15%. The 5-year figure of +397.83% is largely attributable to speculative price spikes disconnected from fundamentals.
There is no P/E ratio calculable, as the company has not reported positive earnings. The enterprise value-to-revenue gap is extreme — a ratio implied by a market cap sustained by speculation rather than fundamentals. No dividends have been declared since listing, meaning all investor return depends entirely on capital appreciation from a highly volatile stock.
5. Investment Decision Analysis: Would You Have Invested?
Stepping back from the data, was FITT.JK a reasonable investment at the time of its IPO? With full benefit of hindsight and the prospectus as a guide, the answer is almost certainly no — for most investors.

Here are five reasons to have avoided the IPO at IDR 102 per share:
1 Pre-existing losses. The company entered its IPO already reporting a net loss of IDR 4.81 billion on revenue of IDR 8.07 billion — a loss ratio of -85.18%. This is not typical startup growth-phase spending; it represents a structurally challenged business model that had persisted since 2014.
2 Stretched valuation. At IDR 102 per share across 600 million post-IPO shares, the implied market capitalisation was approximately IDR 61.2 billion — against only IDR 8 billion in annual revenue and deeply negative earnings. This valuation required a very high future growth rate that has simply not materialised.
3 Disclosed illiquidity risk. The IPO prospectus explicitly warned that the relatively small number of shares offered could result in illiquid trading and that the company could not predict whether active markets would develop. That risk has fully materialised — extreme price swings and thin average daily volume are now the defining characteristics of this stock.
4 Timing-dependent returns. While a current price of IDR 458 nominally represents a 349% gain over the IPO price, the 52-week low of IDR 130 shows how close the stock has traded to its listing price. Any investor unable to time speculative peaks perfectly would have faced near-zero or negative real returns for significant stretches of time.
5 Opportunity cost. An investor who simply tracked the IDX Composite over the same 5-year period would have earned +23.75% with substantially lower risk and volatility. FITT.JK’s speculative 5-year return of +397.83% is largely a function of price spikes, not business performance.
The conclusion: for investors prioritising capital preservation, income, or risk-adjusted returns, FITT.JK did not — and still does not — present a compelling case. The decision, objectively assessed, would be to refrain from investing.
6. Conclusion & Key Takeaways
PT Hotel Fitra International Tbk’s IPO journey offers one of Indonesia’s clearer illustrations of a persistent truth in small-cap capital markets: raising funds is far easier than deploying them effectively.
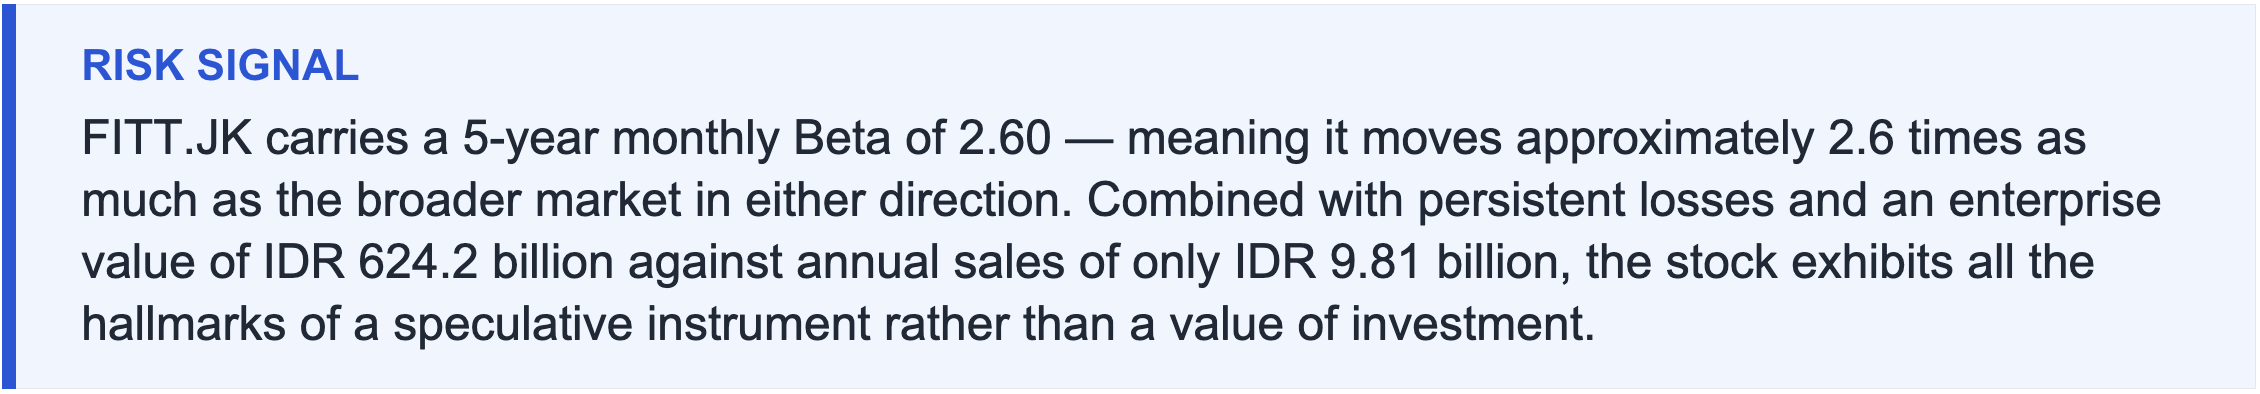
Seven years after raising IDR 22.44 billion from public investors, FITT.JK has grown revenue by only 21.5% in total, continues to generate significant net losses, has declared no dividends, and trades as a highly speculative instrument with a beta of 2.60 and a 52-week range spanning IDR 130 to IDR 1,610.

The lessons for future IPO investors are enduring:
→ Read the prospectus with scrutiny. Pre-IPO financials reveal operational reality, not aspirational targets.
→ Take risk disclosures seriously. If the prospectus warns of illiquidity, believe it.
→ Question the valuation against fundamentals. Revenue multiples matter, especially for loss-making businesses.
→ Consider opportunity cost. The benchmark is always available — and often less risky.
FITT.JK’s story is not unique. Across global emerging markets, small-cap IPOs frequently fail to convert their capital raises into sustainable business performance. For Indonesia’s growing retail investor base, this case study is a timely reminder that the bell ringing on listing day is only the beginning — not the destination.
References
PT Hotel Fitra International Tbk. (2019). Prospektus Penawaran Umum Perdana Saham (IPO Prospectus). Jakarta: Indonesia Stock Exchange. Published May 28, 2019.
Yahoo Finance. (2026). PT Hotel Fitra International Tbk (FITT.JK): Stock Summary and Statistics. Retrieved April 23, 2026.
Indonesia Stock Exchange (IDX). (2024). Company Disclosure Reports: FITT.JK. Retrieved from https://www.idx.co.id
Otoritas Jasa Keuangan (OJK). (2023). Indonesia Capital Market Statistics Annual Report. Jakarta: OJK.
Ritter, J. R. (1991). The Long-Run Performance of Initial Public Offerings. The Journal of Finance, 46(1), 3–27.
Loughran, T., & Ritter, J. R. (1995). The New Issues Puzzle. The Journal of Finance, 50(1), 23–51.
Badan Pusat Statistik (BPS). (2023). Statistik Pariwisata Indonesia (Tourism Statistics Indonesia). Jakarta: BPS.
Comments :