IPO Analysis on PT Sumber Tani Agung Resources TbK (STAA)
Oleh: Noviar Wicaksono|NIM: 2702760553
A. Introduction
- Company Profile
PT Sumber Tani Agung Resources Tbk (hereafter will be referred to as “STAA”), formerly known as PT Sinarlika Portibijaya Plantation and was officially established on July 31, 1993. The name change to PT Sumber Tani Agung Resources was carried out in 2018 with the company’s status changed from a closed company to a public company on September 1, 2021. This STAA is designated as a holding company with several companies owned through direct or indirect participation in subsidiaries (PT Sumber Tani Agung Resources Tbk, 2024).
The structure of STAA is a highly concentrated ownership guide, where controlling shareholders dominate directly or through holdings such as PT Maju Indah Lestari and PT Kedaton Perkasa. This reflects the strong control by a handful of parties who support strategy consistency but have the potential to weaken the influence of minority shareholders.
From operational point of view, the subsidiary companies that include plantation activities, processing, trading, to downstream activities included in the refinery development. Most subsidiaries are owned at a very high level of ownership (≈99%), so that strict control and efficient consolidation can be achieved. Overall, this structure indicates that strategic integration along the palm oil value chain has been carried out by the company, with the aim of maximizing efficiency, margins, and growth in the long term.
- Industry Overview
STAA has been operating in the palm oil plantation and processing sector since 1970 with an integrated process from planting to processing FFB into CPO and its derivative products. Its operations are spread across North Sumatra, South Sumatra, West Kalimantan, Central Kalimantan, and Singapore. In addition, STTA also partners with plasma farmers through a core-plasma scheme.
- IPO Overview
The Initial Public Offering (IPO) in 2022 was carried out by STAA as part of the strategy to strengthen the modeling structure by supporting long-term business expansion. A total of 903,372,600 shares have been issued to the public, including shares allocated to employee participation programs such as issued to the public, including shares allocated to the Employee Stock Allocation (ESA) and Management and Employee Stock Option Program (MESOP) programs. The shares have been offered at a price of IDR 600 per share, so that it can make funds of approximately IDR 542.02 billion before the emission costs are successfully obtained. In addition, options on the overall offer were also included in this IPO to accommodate the excess demand in the market by indicating high investor interest at the time of listing. After the IPO, the Company’s paid-up share capital increased to IDR 1.09 trillion or 10.9 billion shares with a nominal value of IDR 100 per share. Additional funds are recorded as additional paid-up capital so as to provide financial strengthening. Overall, IPOs help to form a more balanced capital structure, improve risk management and returns, and support shareholder value and sustainable growth. Post-IPO Financial Performance
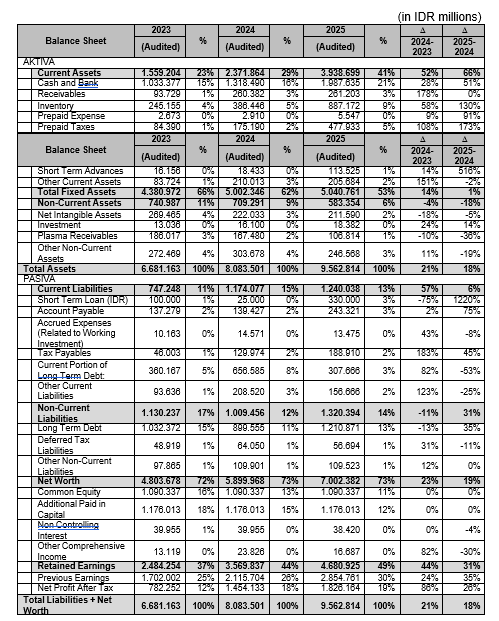
B. Below is the analysis of Balance Sheet of PT Sarana Tani after IPO.
In 2025 current assets have experienced a significant increase of 66%, from IDR 2.37 trillion in 2024 to IDR 3.93 trillion in 2025. The increase indicates higher liquidity and greater short-term asset turnover. Meanwhile, fixed assets with non-current assets have declined in a gradual manner from 2024 to 2025, indicating a reduction in investment expansion in the long term with fixed asset ownership. Overall, STTA’s total assets grew by 18%, from IDR 8.08 trillion to IDR 9.56 trillion. Short-term liabilities increased by around 6% to Rp1.24 trillion more specifically due to long-term debt maturing. Long-term liabilities increased by 31% to Rp1.32 trillion due to additional loans.
STAA’s equity grew 19% to IDR 7.00 trillion as earnings were withheld. Overall, total liabilities and equities increased by 18% in line with asset growth, reflecting solid financial performance despite increased short-term liabilities.
 Source : STAA
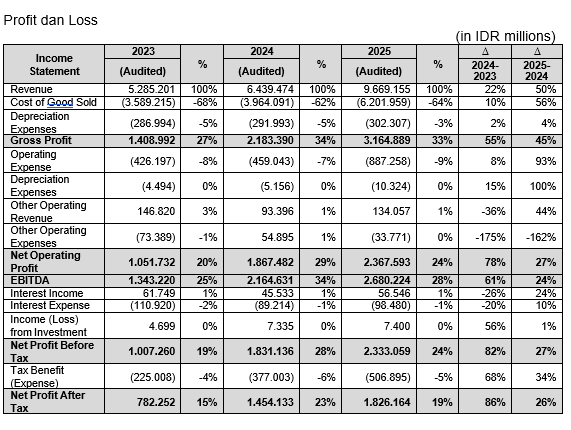
Below is the analysis of Profit and Loss of PT Sarana Tani after IPO.
 Source : STAA
Net sales were recorded at IDR 6.44 trillion or an increase of 21.84% compared to the previous year which amounted to IDR 5.29 trillion. This increase reflects the increase in revenue from the Company’s core business activities. Cost of goods sold also increased by 9.80%, from IDR 3.88 trillion in 2023 to IDR 4.26 trillion in 2024 in line with the increase in operational scale. As a result of this revenue growth, gross profit increased sharply by 54.96%, from IDR 1.41 trillion to IDR 2.18 trillion. Operating profit also experienced a significant increase of 77.56%, from IDR 1.05 trillion in 2023 to IDR 1.87 trillion in 2024. In addition, profit before income tax also increased dramatically by 81.79%, from IDR 1.01 trillion to IDR 1.83 trillion which was boosted by an increase in the selling price of CPO, PK, and CPKO. In 2024, where the average price was recorded to increase by 18.26%, 51.92%, and 63.62%, respectively. This condition was able to generate an annual net profit of IDR 1.45 trillion which increased by 85.89% compared to IDR 782.25 billion in the previous year.
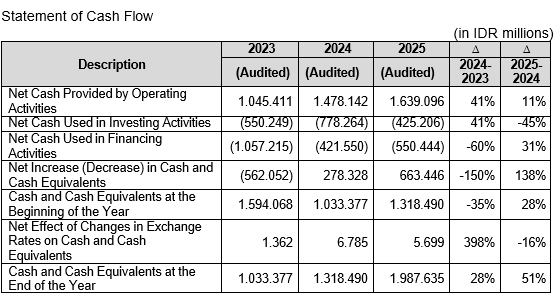
The analysis of cash flow showed significant improvement in STAA. Net cash flow from operating activities increased by 11% to Rp1.64 trillion, in line with increased profitability, while cash outflows from investment activities decreased by 45% to Rp425 billion, indicating efficiency through the construction of palm oil mills with the development of refineries. On the other hand, where outflows from funding activities have increased sharply by 31% to Rp550 billion, which is specifically due to loan disbursement users with dividend distribution. As a result, the company’s net cash position was recorded with a significant increase from IDR 278.33 billion in 2024 to IDR 633.44 billion in 2025, as well as an increase in cash with final cash equivalents reaching 51% to IDR 1.99 trillion. Overall, this condition indicates that an increase in liquidity, the effectiveness in managing cash flow, and a good balance between investment activities and funding have been successfully achieved.
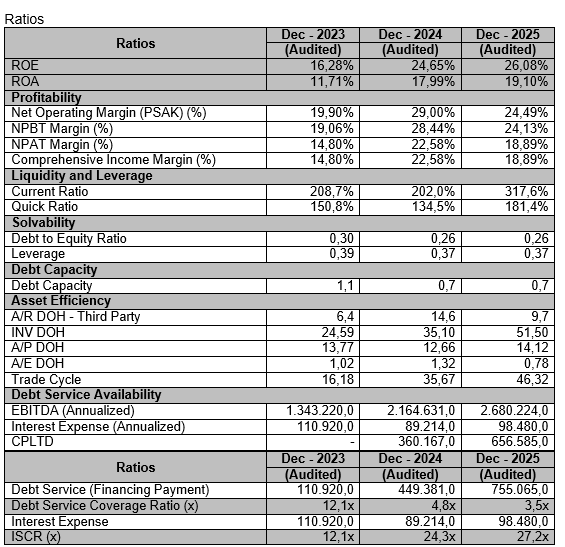
The analysis of financial performance ratio shows relatively stable conditions. The liquidity level is also still in healthy condition as reflected in the current ratio and the cash ratio is stronger than the previous year. This condition provides an indication that short-term liabilities can still be fulfilled by STAA with the use of its current assets. From a capital structure perspective, the debt-to-asset ratio and debt-to-equity ratio showed a more conservative trend compared to previous years. This reflects its efforts to maintain a balance between debt and equity usage to finance operational activities and investments.
Compared to 2024, STTA’s profitability in 2025 gave hints of a significant increase. The return on assets (ROA) and return on equity (ROE) ratio indicates that higher profits are successfully generated by the Company from its assets and capital. In addition, gross profit margin, operating profit margin, and business profit margin also increased, reflecting efficient cost management and increased revenue from core business activities.
The decline in the Debt Service Coverage Ratio (DSCR) trend indicated by the company’s capacity to meet its debt obligations was from 12.1x to 3.5x, which was specifically due to a significant increase in total debt repayment obligations (especially CPLTD/principal repayment). This indicates that although debt payments can still be fulfilled quite comfortably by the company, the security margin is getting narrower along with the increase in commitment in payments. Nevertheless, the Interest Service Coverage Ratio (ISCR) remains in strong condition and has even increased from 12.1x to 27.2x, which means that interest costs can be easily covered by the company’s operating income.
C. Stock Price STAA from IPO until now
At the time of the IPO, the price of IDR 600 per share was used to list STAA, which was also, the lowest price ever recorded. After stocks are listed, fluctuations that are common in companies that are newly listed on the stock exchange begin to be experienced with initial volatility given by market adjustments and investor sentiment (IDN Financials, 2026).
The price movement of the same as STTA over the last 6 months, namely October 2025 to March 2026, has indicated a moderate downward trend followed by a gradual recovery. After the peak of around Rp1,700 in October 2025 was reached, the price decline consistently occurred up to the range of Rp1,150–1,200 in early 2026, indicating a correction period (Trading View, 2026). This decline was influenced by profit-taking actions from investors, broader market adjustments, or external pressures, for example commodity price fluctuations in the palm oil sector. In addition, the decrease in trading volume is also seen with the passage of time which indicates a decline in market activity and the possibility of a decrease in investor interest in the short term.
However, towards March 2026 where signs of stabilization and a slight increase began to be shown by stocks with prices recovering to the range of IDR 1,250+ (Investing.com, 2026). This is an indication that a certain level of confidence in the company’s fundamentals is still maintained by the market even though there was volatility previously. Overall, STAA remains relatively stable above its IPO price with price movements being influenced by internal performance as well as external market conditions.
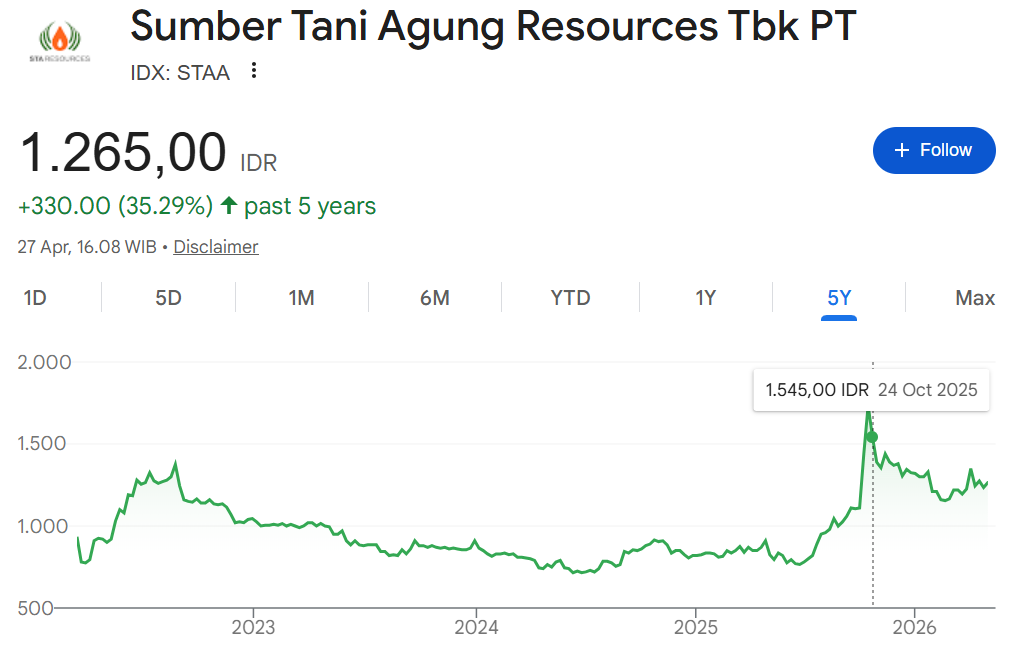 Source : https://www.google.com/search?q=staa&sca
D. Decision Analysis
If I had the opportunity to invest in STAA during the IPO where I would choose an investment with a long-term perspective. This decision was mainly supported by the company’s strong fundamental performance as reflected in significant revenue and profit growth, solid operating cash flow, as well as improved efficiency demonstrated through high profitability ratios such as ROA and ROE. In addition, the effective and disciplined use of IPO proceeds has also been demonstrated by the company by allocating these funds for expansion projects including refinery development and investment in the plantation sector.
This is a guide to focus on long-term value creation through strategic capital allocation that is prioritized by management over short-term or speculative spending. In addition, there is also the potential for attractive returns offered by STAA which can be seen from the significant increase in its share price from IDR 600 at the time of the IPO to more than IDR 1,700 at its peak so that capital gains of more than 200% were obtained by the initial investors. The company also operates in the palm oil industry, which is still a strategic sector in Indonesia, with strong demand driven by food consumption and biodiesel development. However, various key risks still need to be considered in making an investment decision, including commodity price volatility, dependence on export markets, and broader macroeconomic conditions. Despite this, attractive investment opportunities for long-term investors remain demonstrated by the company due to its strong fundamentals and position within the industry.
E. Conclusion
I will conclude this analysis with the decision to invest in STAA during the IPO because of its strong fundamentals, effective capital allocation, and significant growth potential shown by the company despite exposure to risks related to commodities. For long-term investors themselves, a solid opportunity to be able to benefit from business expansion and stock price appreciation can be represented by STAA.
F. Reference
PT Sumber Tani Agung Resources Tbk. (2024). Annual Report 2024. Retrieved from
https://www.sta.co.id
IDN Financials. (2026). PT Sumber Tani Agung Resources Tbk (STAA) – Company Profile
& IPO Data. Retrieved from https://www.idnfinancials.com
Investing.com. (2026). PT Sumber Tani Agung Resources Tbk Historical Stock Data.
Retrieved from https://www.investing.com
TradingView. (2026). STAA Stock Price Chart and Historical Performance. Retrieved from
https://www.tradingview.com
Investing.com. (2026). STAA Stock Performance Trends and Analysis. Retrieved from
https://www.investing.com
Comments :